

Gold Just Crashed 25% — Here's What the Charts Are Screaming
PLUS the GYP Weekend Market Intelligence Report

Weekend of June 27–28, 2026 · Market Intelligence
A weekend read for both sides of your brain — the trader looking for the next high-probability setup, and the investor thinking in quarters and years.
This week the market’s character changed, leadership rotated, and one of our favorite long-term assets — gold — kept sliding. Here’s the macro, the five stories that mattered, and a featured technical breakdown of GLD.

Featured Technical Breakdown — Gold (GLD)
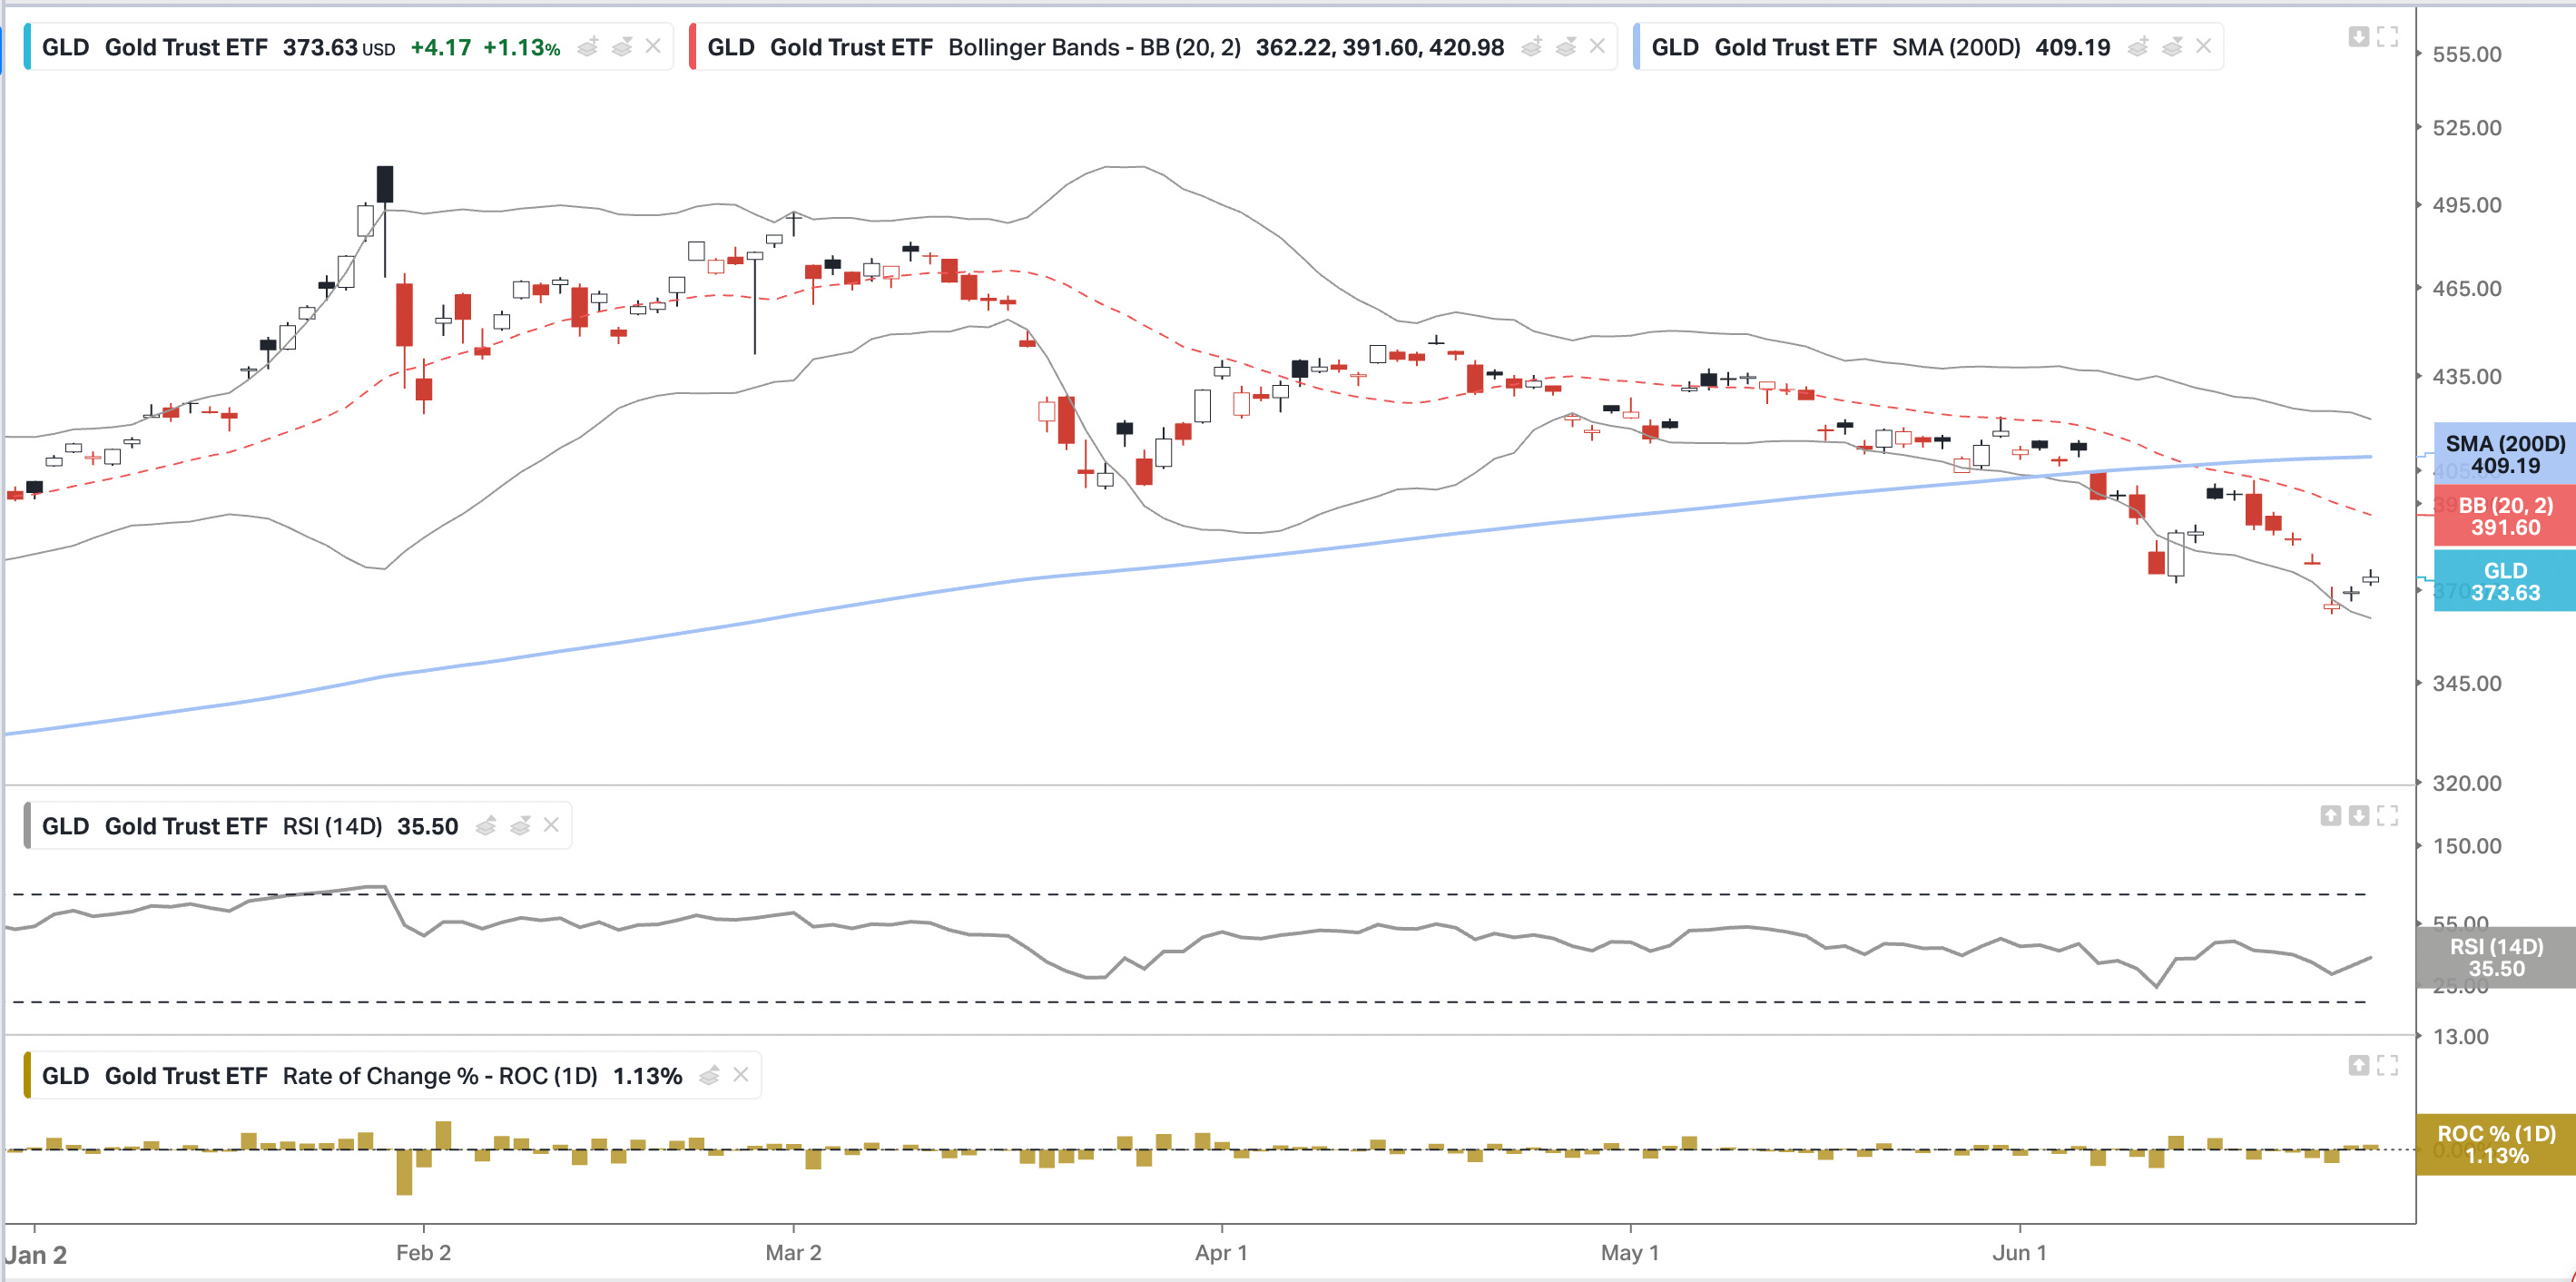
Charts below. Levels as of Friday’s close: GLD $373.63 (+1.13% on the day), spot gold ≈ $4,000/oz.
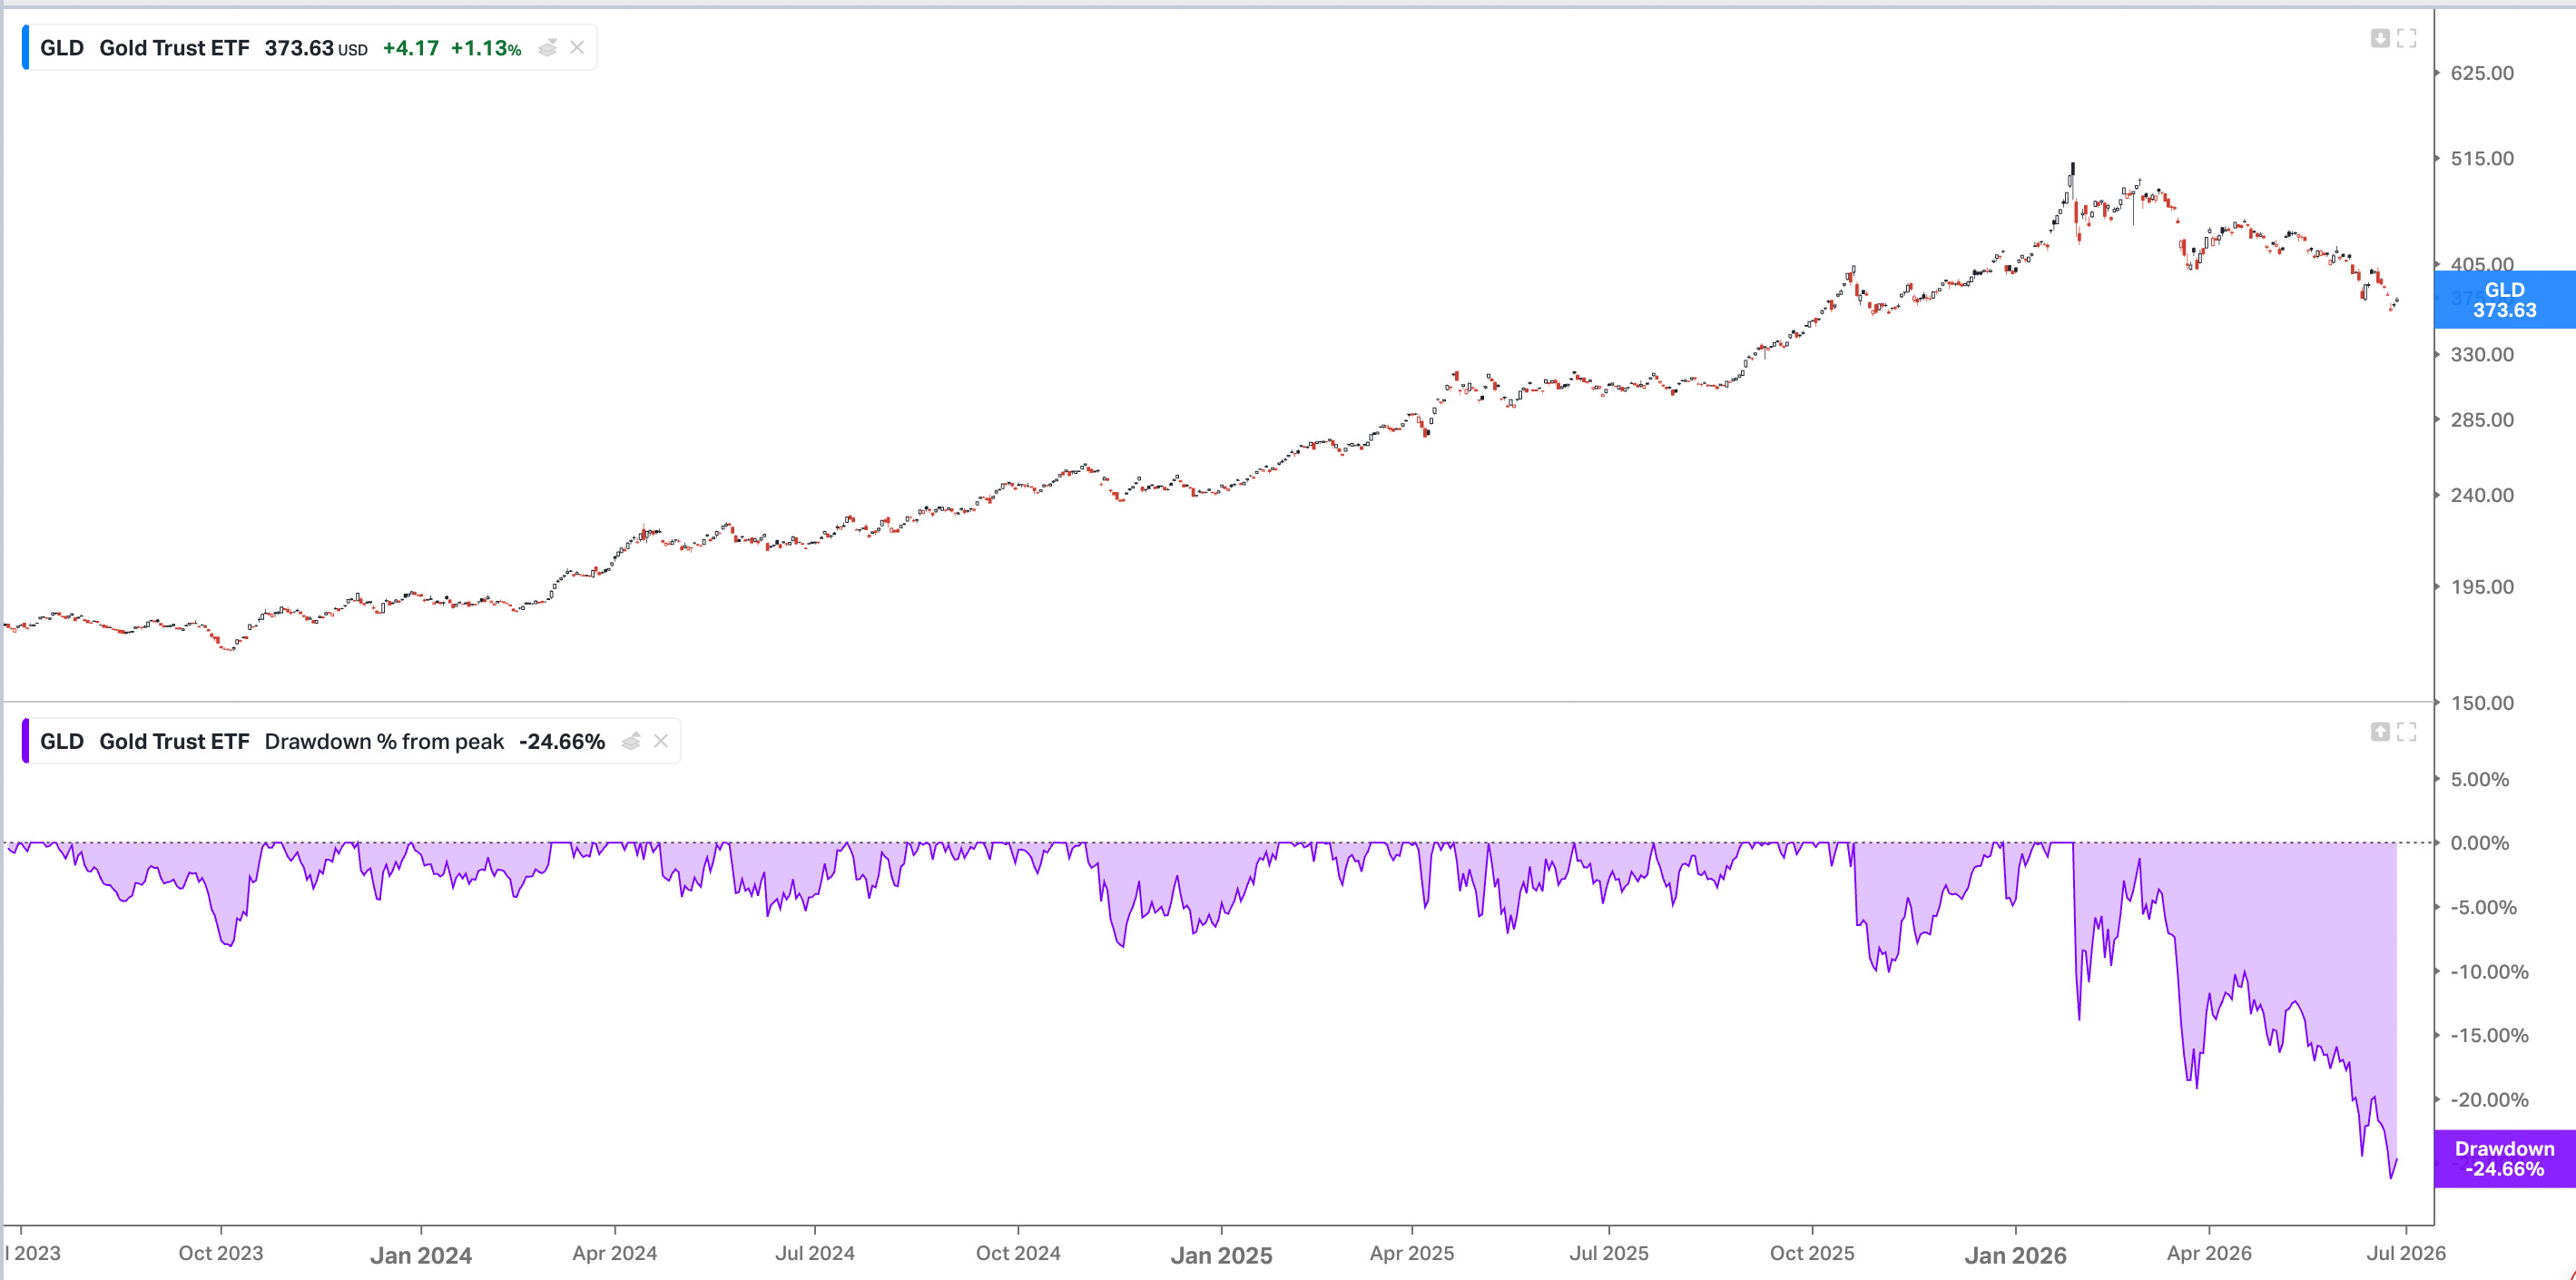
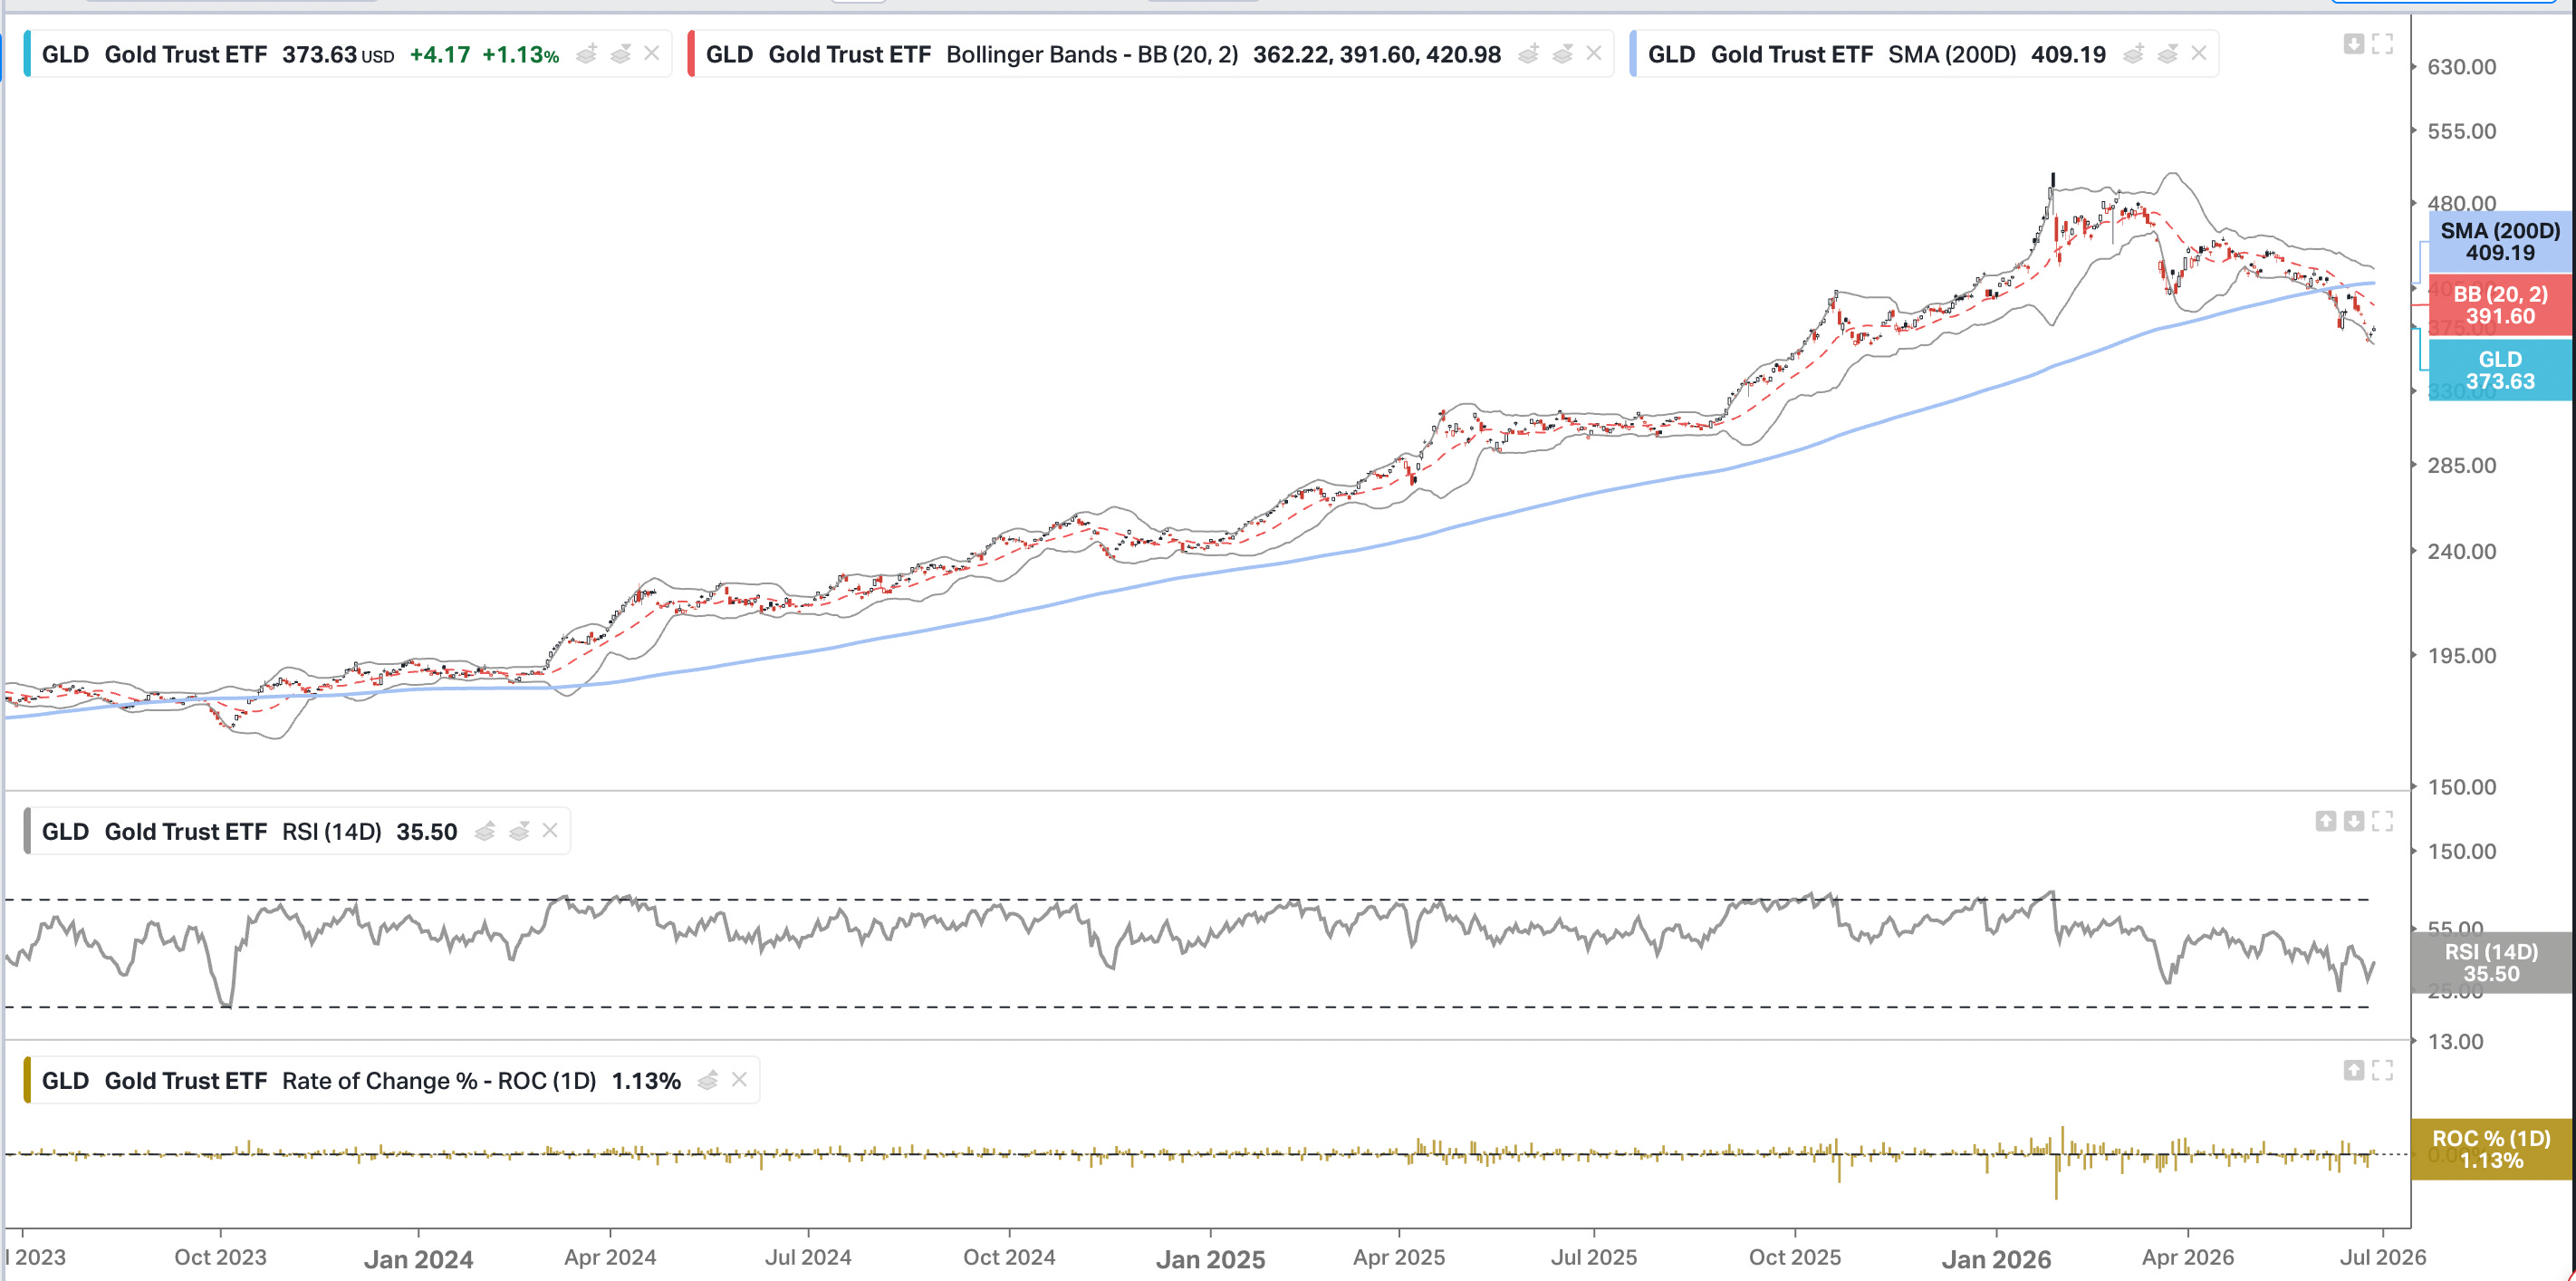
Gold has gone from the market’s golden child at the start of the year to its redheaded stepchild today. Step back to the multi-year picture and the story is dramatic: GLD ran from roughly $180 in 2023 to a peak near $496 in early 2026 — and has now pulled back to $373.63, a −24.66% draw-down from that peak. That’s the deepest decline of the entire three-year bull run, and it has dragged price below its 200-day moving average ($409.19) for the first time since the advance began.
The trend (the big one). Losing the 200-day after years above it is a genuine technical regime change — the long-term trend is being tested, not casually wobbling. Price is also below the 20-day average / Bollinger midline at $391.60, confirming the short- and intermediate-term downtrend.
The levels that matter:
Support: the lower Bollinger Band at ~$362 is the line in the sand — price has been riding it down. Below that, look to the round $355 / $350 zone (where we’ve been selling put premium, not buying outright).
Resistance: first the 20-day / Bollinger mid at ~$392, then the big one — the 200-day at ~$409. GLD needs to reclaim $392 to stabilize and $409 to repair the broken long-term trend.
Momentum. RSI(14) sits at 35.5 — weak and near oversold (it tagged ~30 at the June low and is now turning up), and price bounced +1.13% Friday off the lower band. That’s a classic oversold-relief setup — a tradable bounce can happen here — but a bounce inside a downtrend is not the same as a trend change. Respect the difference.
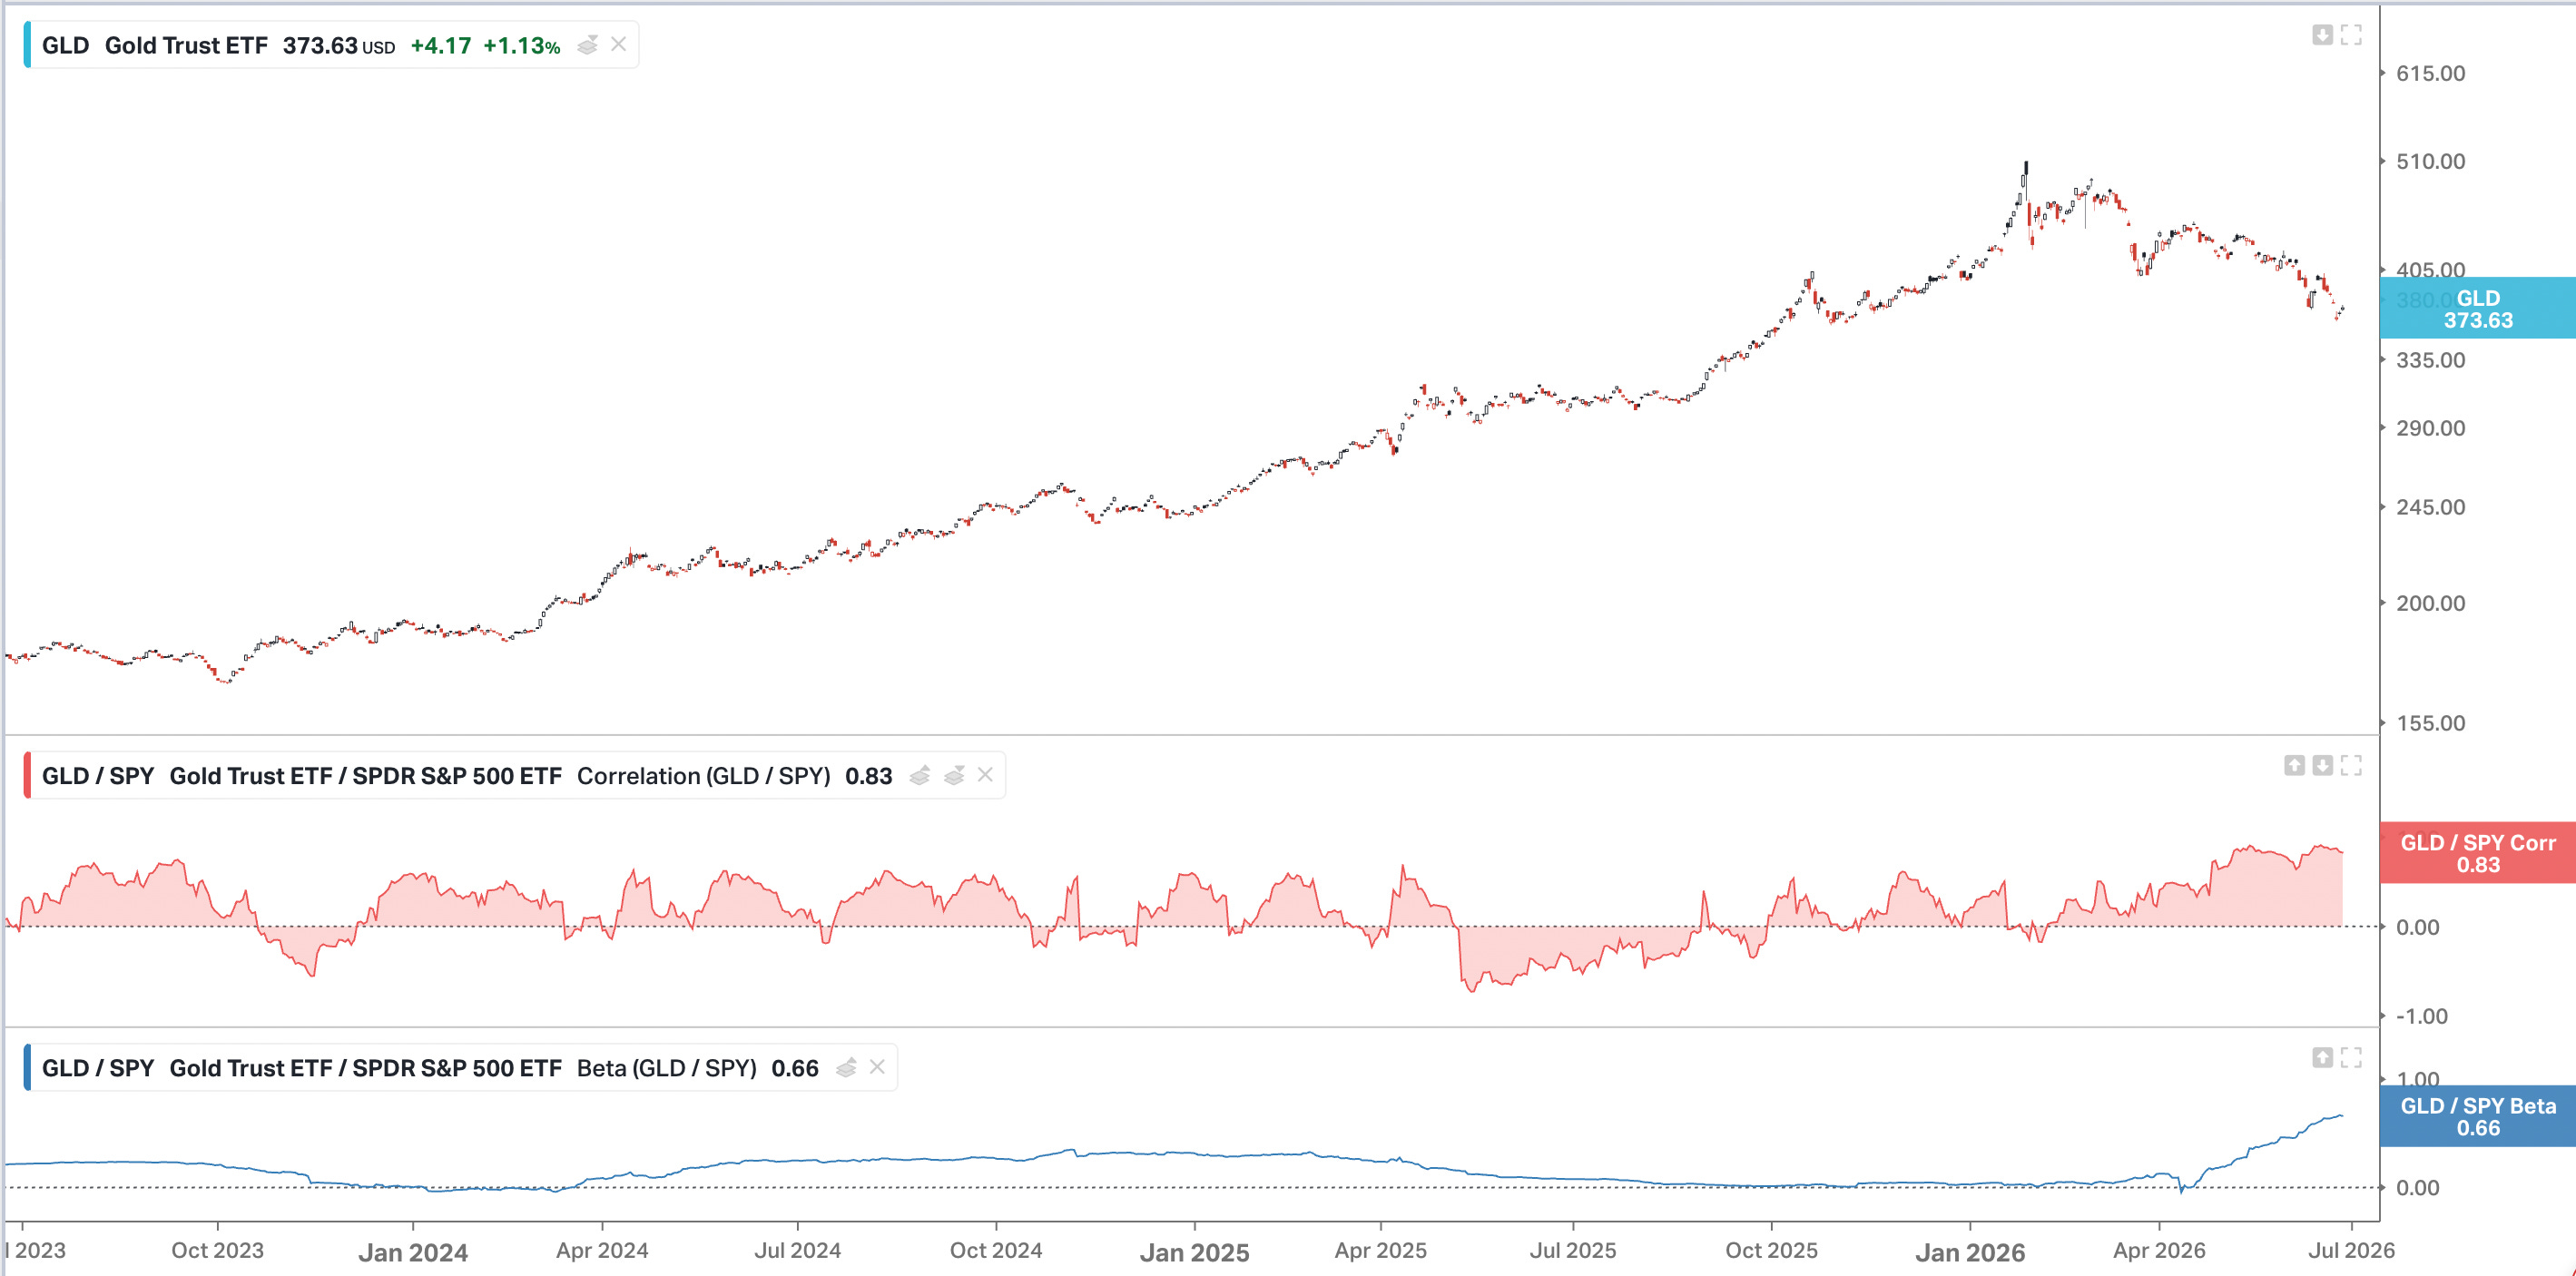
The correlation tell (don’t miss this). Right now GLD’s correlation to the S&P 500 is 0.83 with a rising beta (~0.66) — meaning gold is currently moving with stocks, not against them. In plain English: gold is trading like a risk asset and is not providing its usual diversification at the moment. That’s a key nuance — the “safe haven” isn’t acting like one while the dollar and real rates are in the driver’s seat.
Why it’s falling. A clean macro chain: lower oil → lower inflation expectations → a stronger dollar (our rates are relatively attractive) → less demand for inflation hedges like gold and silver. The same force pressuring metals is the one helping stocks — which is exactly why the correlation is so high.
Trader: Don’t try to catch the exact bottom of a falling knife below the 200-day. The RSI-35 bounce off the $362 band is a relief setup, not a green light — if you play it, define risk and lean on the rich gold IV (sell puts where you’d be happy to own it, or use defined-risk bullish structures). The trend doesn’t turn until $392, then $409, are reclaimed.
Investor: A −24.66% drawdown is a real correction, but the secular case (central-bank demand, debasement hedge) and the still-rising 200-day argue the long-term uptrend isn’t broken — yet. Two caveats: gold isn’t hedging your equities right now (0.83 correlation), and you don’t need to catch the low. Accumulate patiently on a plan into the $362–$355 support zone rather than panic-selling a long-term diversifier near oversold.
This Week’s Market Intelligence
The big picture: Two forces defined the week. A geopolitical de-escalation (US–Iran progress, an open Strait of Hormuz) pulled the war premium out of oil and the fear premium out of metals — while a hot PCE inflation print (4.1% headline / 3.4% core) confirmed a hawkish, Warsh-led Fed whose dot plot now flags a possible hike. The result wasn’t a crash or a melt-up — it was a rotation: mega-cap tech wobbled (the Nasdaq’s first 4-day losing streak since February) while the Dow and small caps held up.
Volatility: VIX climbed back to ~19–20 — right at its long-run average. Not cheap, not rich. The fat, easy premium of a sub-18 VIX is gone; sizing matters more now.
Rates & the Fed: Held at 3.50–3.75%, but the June dots removed the 2026 cut and lean toward a hike; the 10-year sits ~4.4%. Rates are back as the swing factor.
Cross-asset: The dollar pushed to a 15-month high — the direct cause of the metals selloff. Gold and silver fell hard, crude broke back below $70, while credit stayed calm (a rate/dollar repricing, not a credit scare).
Breadth: This is the healthy part — leadership is broadening out of a handful of AI names into industrials, financials, and small caps (the Russell 2000 has been a standout).
Sentiment: A classic divergence — CNN’s Fear & Greed reads “Fear,” yet options hedging stays complacent. Emotion is running ahead of actual positioning.
Trader’s lens: A two-sided, headline-driven tape into a holiday-shortened week (June jobs lands Thursday, July 2; markets close early July 3 and shut July 4). Thin liquidity can exaggerate the data reaction — keep risk defined and don’t over-stay momentum.
Investor’s lens: None of this breaks the longer-term bull case. Earnings are solid and breadth is improving. But after a historic run, this is a “review and re-balance” moment — trim oversized winners, keep some dry powder.
The Five Stories That Moved Markets
1. Technology finally took a breather. The Nasdaq logged one of its weakest weeks in months as investors booked profits after the spring rally; semiconductors led the decline. The Dow held up — money rotated, it didn’t leave.
Trader: Momentum names are more volatile now — expect bigger intraday swings, avoid chasing extended charts.
Investor: Long-term AI fundamentals are intact; periodic corrections after a run like this are healthy.
2. Market leadership is beginning to rotate. Breadth improved as the Dow and small caps outperformed mega-cap tech — capital rotating, not exiting.
Trader: Look at industrials, financials, and small caps as leadership widens.
Investor: Broader participation supports a more durable bull market than one carried by a few names.
3. AI demand is still exploding. Even as AI stocks pulled back, the fundamentals strengthened — Micron’s blowout earnings flagged enormous high-bandwidth-memory demand, and supply constraints are now forcing price hikes (even Apple).
Trader: Theme intact, but it’s a stock-picker’s market now, not indiscriminate buying.
Investor: The AI infrastructure buildout remains one of the strongest secular themes out there.
4. Rates, inflation, and the Fed are the biggest macro driver. Inflation is stabilizing but the Fed path is uncertain; yields eased slightly, yet markets hang on every print and comment.
Trader: Keep one eye on the bond market — lower yields help growth, higher yields trigger rotation.
Investor: The bull case holds, but policy will steer sector leadership all summer.
5. The easy money is gone — now execution matters. The powerful momentum phase is maturing. Markets are more selective, rotations are increasing, volatility is creeping back.
Trader: This is becoming a trader’s market again — risk management, sizing, and high-probability setups over chasing.
Investor: Stay invested, but review the portfolio — trim winners, rebalance, hold dry powder.
Bottom Line
The theme of the week — across stocks and gold alike — is that the character of the market has changed. The momentum phase is maturing, leadership is rotating, and the unloved corners (metals, energy) are where tomorrow’s opportunities are quietly forming. Our job isn’t to predict the next headline. It’s to trade the market we have — define risk, get paid for patience, and stay ready for the high-probability setup when it arrives. Sometimes the best opportunities appear when everyone else has stopped looking.
Every position, hedge, and roll across all three portfolios is live, in real money, on the member dashboard at growyourpile.com.
Educational content from the Grow Your Pile team. Not investment advice or a recommendation to buy or sell any security. Options and futures involve substantial risk and are not suitable for all investors. Past performance is not indicative of future results. Figures are point-in-time and will change.
— Tony Battista & Tony Rihan Grow Your Pile