


The Bond Market Is Running This Morning
Stocks are down, and if that were the whole story we’d have skipped today. It isn’t. The move that matters this morning is in the long end of the bond market, and not only ours. Britain’s thirty-year gilt printed its highest yield since 1998 earlier today. The US ten-year is at 5.322% and the thirty-year at 5.698%. When the price of money goes up in several countries at once, everything priced off it has to adjust, and you can see that adjustment all over this morning’s tape if you look past the index level.
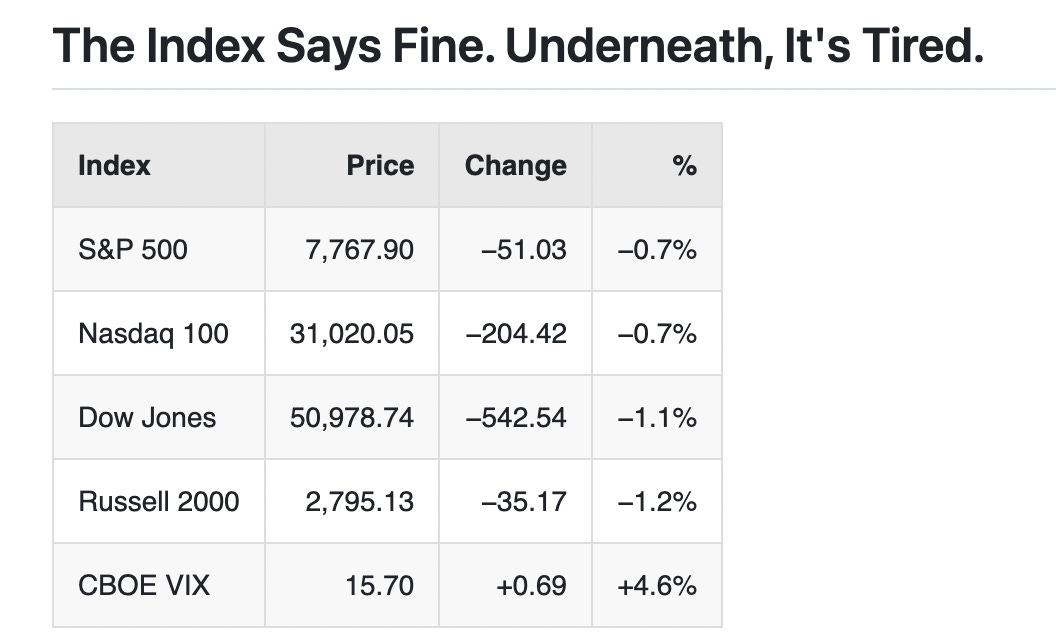
The S&P is off 0.7%. The Dow’s off 1.1% and the Russell 1.2%. Two of the eleven sectors are green. All fourteen global funds are red, and all nine boxes on the style grid are red too, with mid caps doing worse than large. Gold is down 1.6% on a morning when you’d think somebody would want it. Oil’s up. And Intel, Micron and Sandisk are green while WDC, which one trader we read calls “unstoppable earlier this year,” is half off its all-time high.
Britain Hasn’t Paid This Much Since 1998
The headline, as it ran on the wire:
“UK 30-YEAR GILT YIELDS RISE TO HIGHEST SINCE 1998 AT 6.034%, UP MORE THAN 12 BPS ON DAY”
By 10:29 the thirty-year read 5.983%. The story is the level.
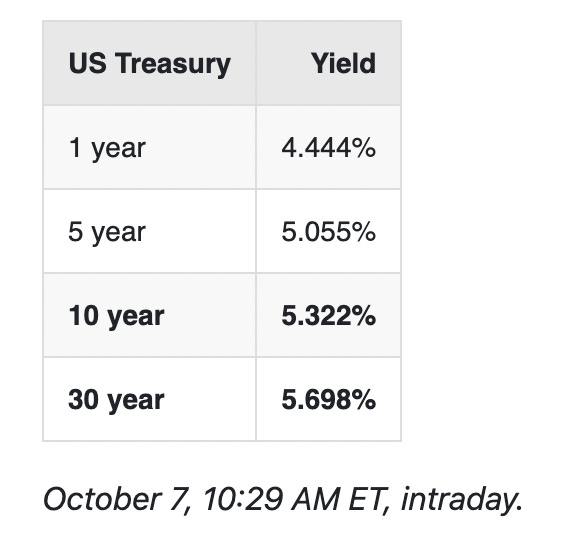
The ten-year is 5.322%. The thirty-year is 5.698%. From the one-year to the thirty-year is a bit over 125 basis points. Lenders want about a point and a quarter more a year to lend to Washington for thirty years than for one. That’s the bond market asking to be paid for not knowing what the next three decades look like.
Tony Rihan put the starting point on X back on September 24:
“U.S. 10-year Treasury yields climbed above 5.1%, their highest level since 2007, after a much stronger-than-expected PMI report reinforced concerns that economic momentum remains robust despite higher”
The post is cut off there. Thirteen days later the ten-year reads 5.322%. Three days after that first post he wrote, “Government bond yields are reaching levels we haven’t seen in many years,” and called the ten-year “essentially the base interest rate.” Our read: mortgages, corporate loans and the discount rate on every stock you own all hang off this number. When it’s above five, a lot of things that looked cheap at four aren’t.
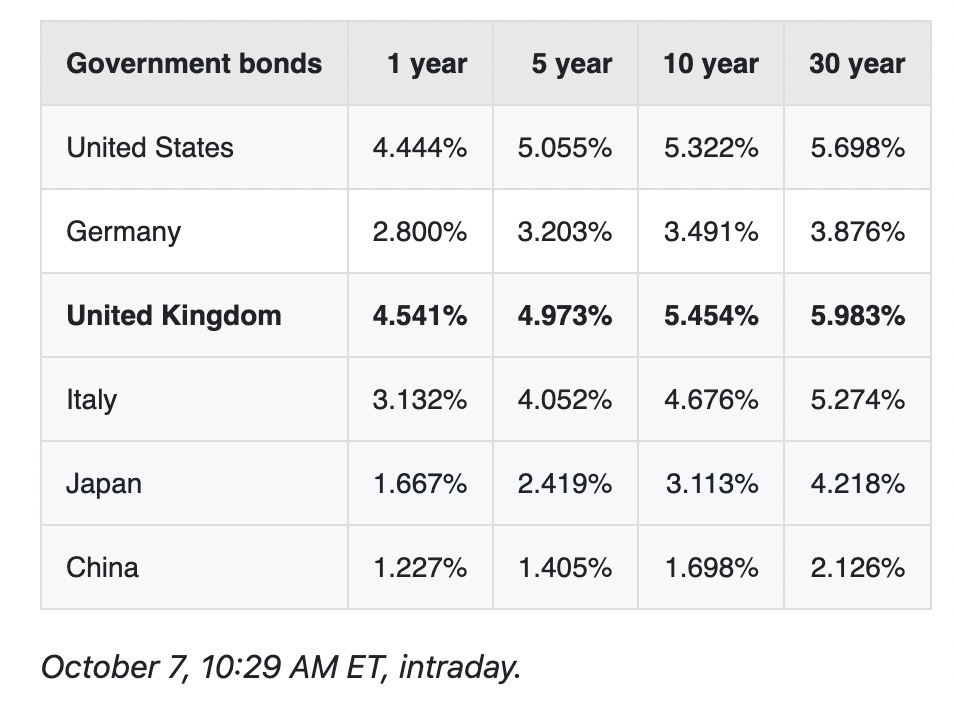
Britain pays more than the United States for ten years and for thirty. Its ten-year is 5.454% against our 5.322%, so 13.2 basis points more. Its thirty-year is 5.983% against 5.698%, so 28.5 more. The US pays 183 basis points more than Germany for ten years and 221 more than Japan.
Japan’s thirty-year is 4.218%. For a country that spent years with rates pinned near zero, that’s a lot to pay.
And then there’s China, which is the odd one out. The wire carried this, from the Wall Street Journal:
“BOND YIELDS ARE SURGING AROUND THE WORLD—BUT NOT IN CHINA - WSJ”
China’s thirty-year pays 2.126%. The US government pays 4.444% to borrow for one year. Beijing borrows for three decades at less than half of what Washington pays for twelve months.
The currencies say firm dollar. Sterling’s off half a percent against it and the euro’s off more, 0.7%.
Jim Cramer, this morning, on the ten-year and the auction:
“in the old days you would have been shorting the ten year for the last 24 hours and you cover on the auction. Should it really be different?”
That’s the old desk habit: lean short into the supply, buy it back once the auction clears. He’s asking whether anything has changed. Fair question.
Then housing, which is where the ten-year turns into something people feel.
Peter Schiff:
“When mortgage rates were 3%, the monthly payment on a $500K house with 10% down was about $1,900. When rates rise to 9% next year, the same mortgage will cost over $3,600. At that rate, to reduce the payment to $1,900, the price of the house would have to fall by nearly 50%.”
We ran his arithmetic and it holds. Ten percent down on $500,000 is a $450,000 loan. On a thirty-year schedule that’s about $1,897 a month at 3% and about $3,621 at 9%. To get back to $1,900 at 9%, the house has to be worth about 47.5% less. The 9% is a different matter. That’s Schiff’s forecast for next year. It isn’t ours and it isn’t anywhere on today’s tables.
The real-economy version came from Benzinga, quoting RPM International’s chief executive:
“RPM International ($RPM) CEO Frank Sullivan says U.S. housing turnover is at a 40-year low and “not going to get better” yet. He says higher mortgage rates continue to weigh on housing-sensitive demand and consumer spending.”
Benzinga’s quote card had RPM down 1.36%. The real estate sector is down 1.0% this morning.
Right after the opening bell, the wire had it like this:
“DOW JONES DOWN 325.06 POINTS, OR 0.63 PERCENT, AT 51,196.22 AFTER MARKET OPEN / S&P 500 DOWN 32.60 POINTS, OR 0.42 PERCENT, AT 7,786.33 AFTER MARKET OPEN / NASDAQ DOWN 155.83 POINTS, OR 0.56 PERCENT, AT 27,444.06 AFTER MARKET OPEN”
Then, a bit later: “U.S. STOCKS EXTEND FALL, DOW JONES DOWN 1.00 PCT.” By 10:29 the Dow was down 542.54 and the S&P down 51.03. So the selling didn’t stop at the open, it built. One thing to keep straight: the 27,444 in that wire item is the Nasdaq Composite. The 31,020.05 in the table is the Nasdaq 100. They’re different indices and you can’t compare the two numbers.
The Dow is the worst of the big three, and the wire points at one reason:
“CATERPILLAR SHARES FALL MORE THAN 5%; WORST DECLINER IN DOW”
Year to date, as of this morning’s prices, the Nasdaq 100 is up 22.85%, the S&P 13.47%, the Russell 12.62% and the Dow 6.07%. Nobody’s year is ruined. That’s exactly why the next part matters.
The VIX is 15.70, up 4.6%. That’s an ordinary number. Options Action asked this morning:
“The rally has its haters in the options market. Are they being vindicated today?”
A VIX in the middle teens says the options market as a whole isn’t panicking. Not yet, anyway.
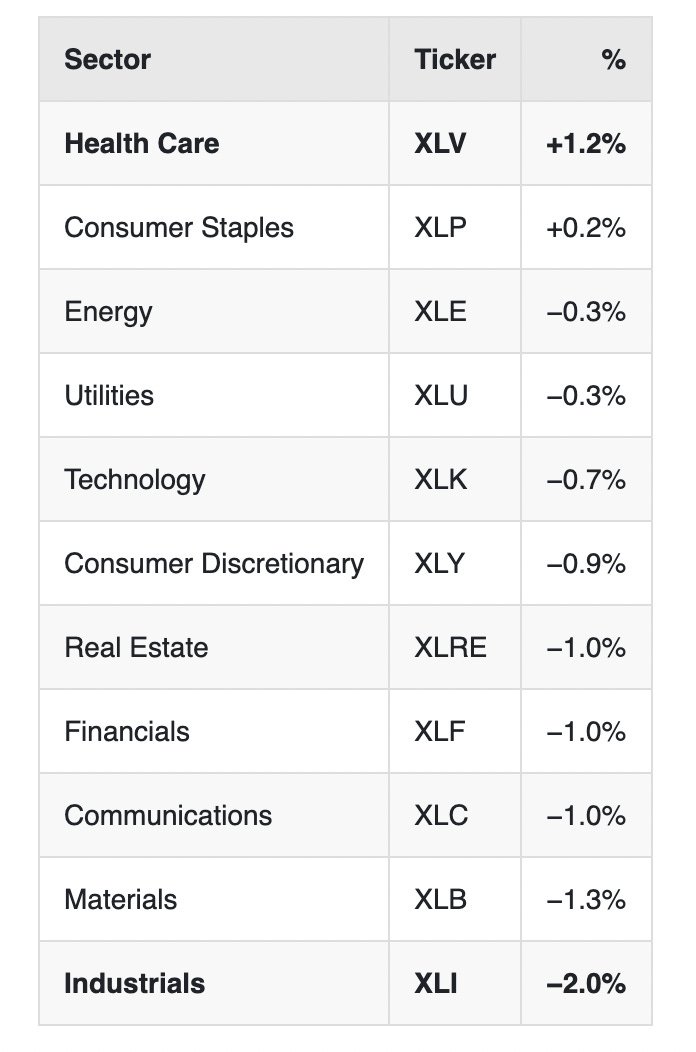
Two green out of eleven, and they're the two you'd pick if you were nervous: health care up 1.2%, staples up two tenths. Industrials are last at 2.0%, on the same morning Caterpillar is down more than 5%. From the top of the board to the bottom is 3.2 points.
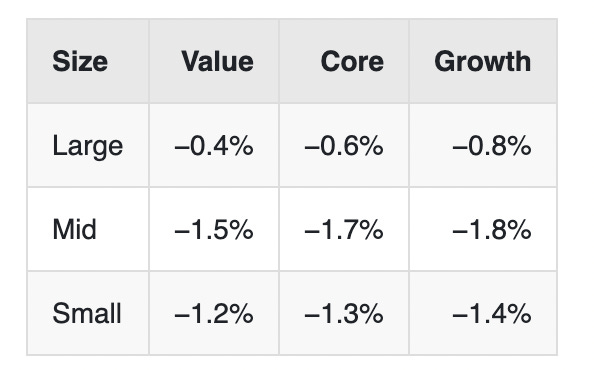
This little grid is worth more than the index level today. All nine boxes are red. Large-cap value is the best of them at 0.4%. Mid-cap growth is the worst at 1.8%. Growth is worse than value in every row, and mid caps are worse than small caps in every column. When the big, boring names hold up and everything smaller and racier gets sold, that’s money getting careful, not money getting out.
Now the call that was making the rounds. From the wire:
“BTIG WARNS OF “BUYER EXHAUSTION” IN SPY. BTIG flags a potential buying-climax signal after SPY posted at least six consecutive gap-ups into a 52-week high, followed by a gap-down of more than 40bp.”
The item is cut off partway through a list of earlier occurrences. unusual_whales carried the same call: “”There is buy exhaustion in SPY,” per BTIG.”
SPY is at 774.33 this morning, 0.93% below its 52-week high of 781.62, up 1.33% on the week and 13.55% on the year. So it’s sitting just under its high, which is where BTIG’s setup starts.
Joe Kunkle (OptionsHawk), early in the session:
“Breadth still trending down, not a single + TICK opening 30”
The NYSE TICK is the number of stocks trading on an uptick minus those on a downtick at that moment. Not one positive reading in the first half hour is a lopsided open. It fits the style grid above.
Tony Rihan made the same point about breadth back on September 25:
“Underneath the surface over 1/2 the S&P 500 names are below the 200 day moving averages. Much different perspective than the S&P 500 about 1% from all time high.”
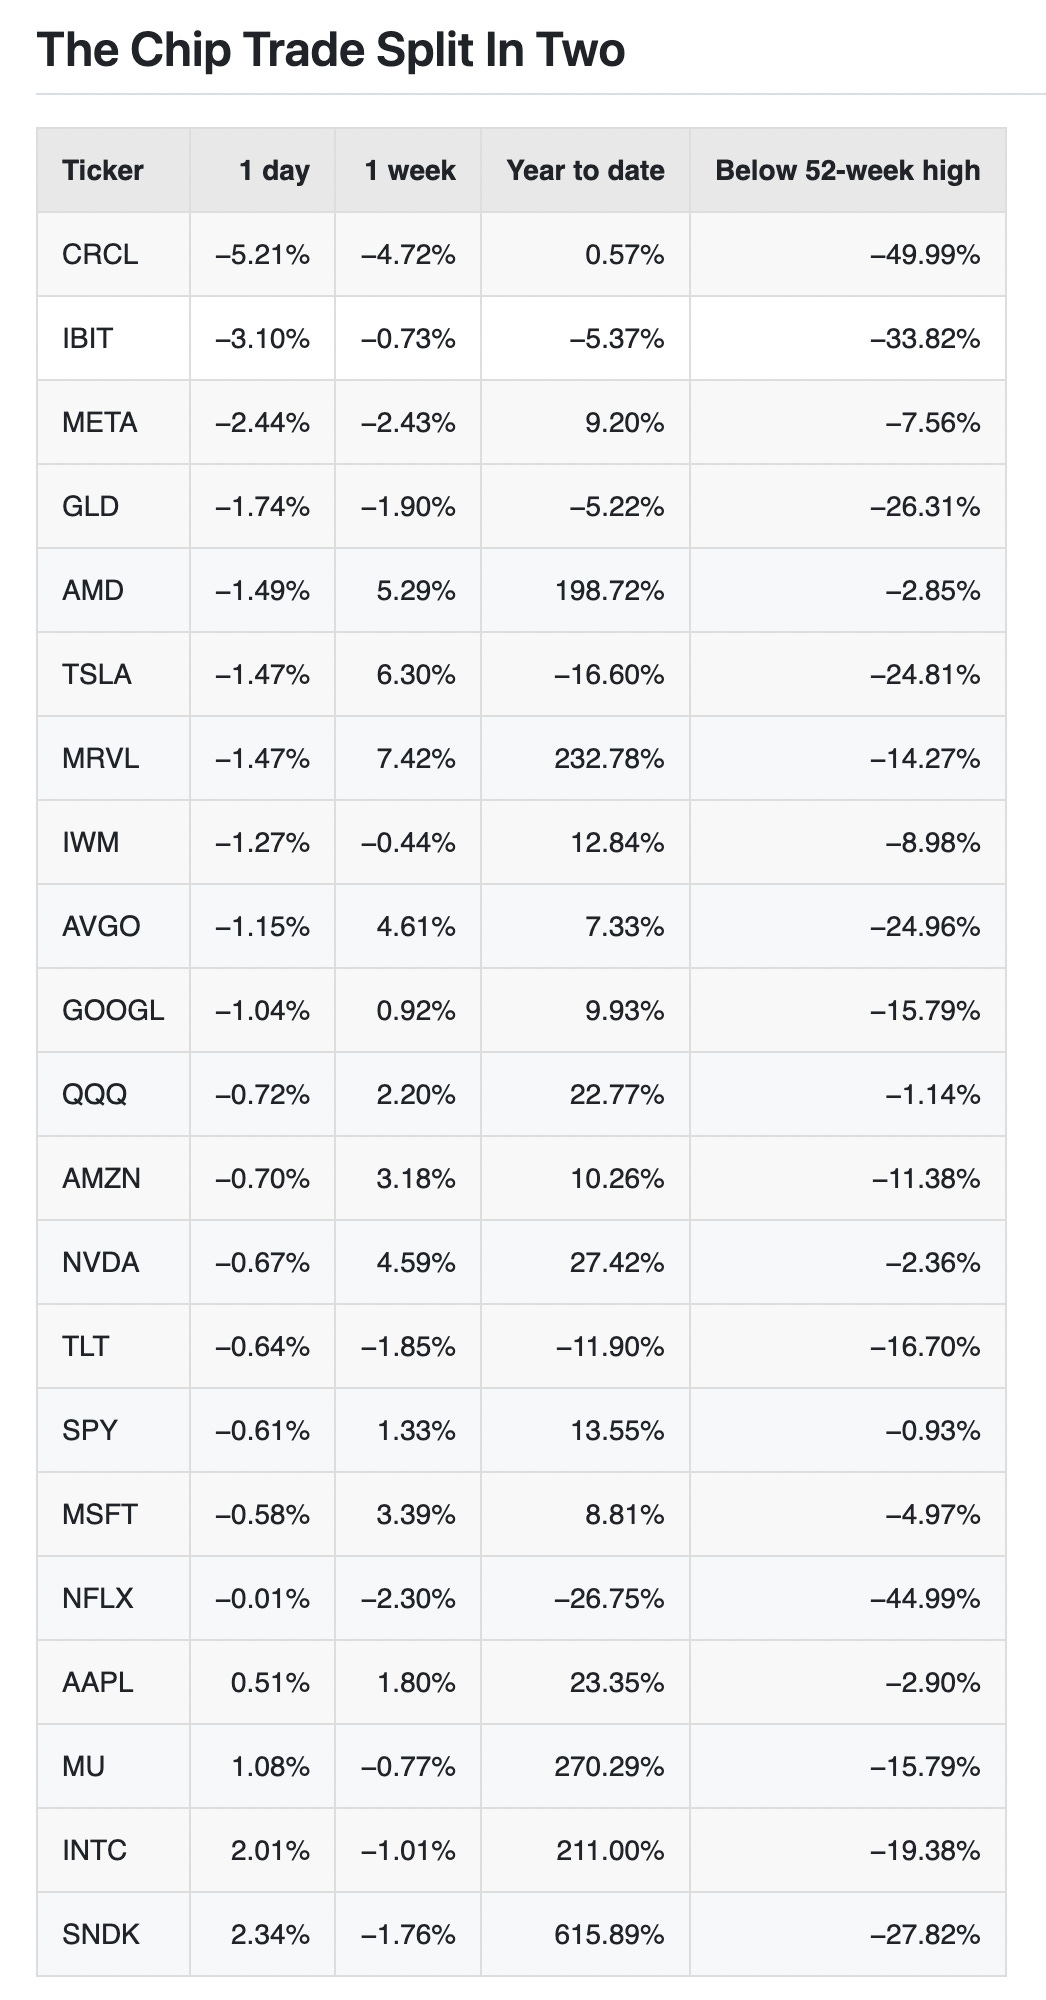
Four of the twenty-one are green, and three of the four are chip and memory names: Sandisk up 2.34%, Intel 2.01%, Micron 1.08%. Apple’s the fourth, up half a percent. Joe Kunkle again:
“$INTC HOD, early weekly call buyer big score”
So at the time he posted, Intel was at its high of the day and somebody who’d bought short-dated calls early had been paid for it.
Look at the right-hand columns before you get excited, though. These are huge winners on the year. Sandisk is up 615.89% year to date, Micron 270.29%, Intel 211.00%. They’re also well off their highs: Sandisk 27.82% below its 52-week high, Intel 19.38% below, Micron 15.79% below. A green day inside a pullback is still a pullback.
And then the other side of the trade. Heisenberg:
“Wow $WDC now down a smooth 50% from ATH’s. This name was unstoppable earlier this year.”
On the same morning, this came off CNBC by way of the wire:
“MARVELL TECHNOLOGIES CEO MATT MURPHY: IMPLIED DATA CENTER REVENUE COULD TOP $30 BILLION BY 2028 - CNBC”
Jim Cramer posted that Murphy was visiting Post 9. Marvell was down 1.47% at 10:29, up 7.42% on the week and up 232.78% on the year. A chief executive putting a big number on the future and his stock slipping the same morning isn’t a contradiction, and we wouldn’t read much into one morning’s move either way.
Then the financing headline:
“$SPCX - SPACEX SHARES FALL 1.5%; FT REPORTS CO SEEKING $40 BILLION FINANCING TO BUY NVIDIA CHIPS”
The quote card attached to that post showed SpaceX stock at $168.17, down 2.18%. NVIDIA was down 0.67% at 10:29, 2.36% below its 52-week high and up 27.42% on the year.
We keep coming back to this because of something Tony Rihan wrote on September 27:
“The AI investment boom may be creating a classic capital-cycle bubble. Microsoft, Amazon, Meta, Google and Oracle are committing extraordinary amounts of money to data centers, chips and computing capacity based on today’s explosive demand.”
Four of the five companies he named are on the watchlist. All four are red this morning: Meta down 2.44%, Alphabet 1.04%, Amazon 0.70%, Microsoft 0.58%. One morning doesn’t prove anything. It’s still worth noticing that the buyers are red while some of the sellers of chips are green.
Same day, he put it in pickleball terms:
“Imagine if Ai was the Sport of Pickleball: Pickleball demand in San Diego suddenly needs 10 new pickleball facilities. Everyone sees the opportunity. So developers start building. But they don’t build 10. They build 100. Initially, everything looks fantastic: Land prices rise.”
The visible part of that post stops there. The point isn’t the ending, it’s the shape. Demand is real, money floods in to meet it, and for a while everyone looks like a genius. A $30 billion revenue forecast, a $40 billion financing to buy chips, three chip names green and one 50% off its high: those can all sit on the same screen at once. If he’s right that this is a capital cycle, that’s what the middle of one looks like.
Will Gold Ever Have An Up Day?
Tony Rihan asked exactly that on September 22. Fifteen days later, this morning didn’t answer it.
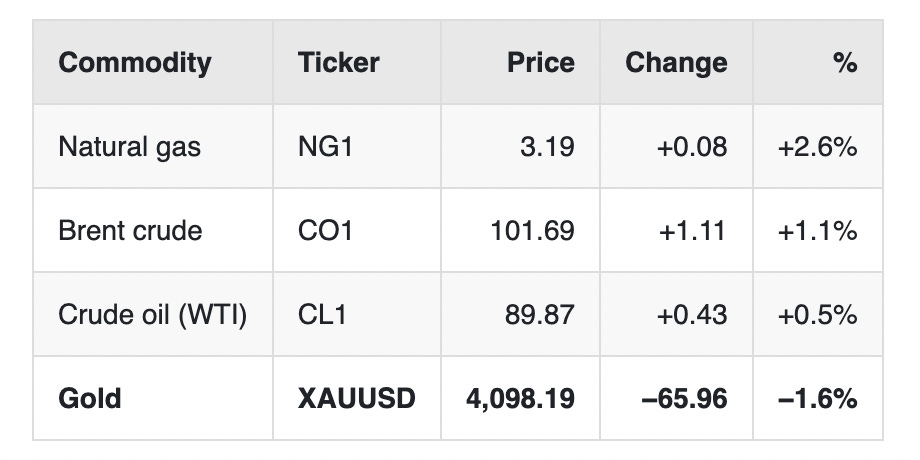
Gold is down 65.96 to 4,098.19, off 1.6%. GLD, the fund, is down 1.74% today, 1.90% on the week, 1.37% so far in October and 5.22% on the year. It’s 26.31% below its 52-week high and only 4.30% above its 52-week low.
Heisenberg, this morning:
“$GLD fresh 13 month low today relative to the $SPY. $GLD fresh 18 month low today relative to the $QQQ. Paging Peter Schiff.”
Frank Giustra posted a video from a Colorado summit under this line:
“Colorado summit video: Giustra says gold rally is missing retail”
We think the bond story and the gold story are the same story. Gold pays you nothing to hold it. When the US government pays 5.322% for ten years, owning something with no income costs you more than it used to, and that cost goes up every time the ten-year does. That doesn’t make gold a bad asset. It makes it an expensive one to wait in, on mornings like this.
Bitcoin isn’t helping the people who want an alternative to paper money either. It’s down 3.0%, and more on that below.
Oil Was Up Before The Inventory Number Came Out
Brent is 101.69, up 1.1%. WTI is 89.87, up 0.5%. Natural gas is up 2.6%. That puts Brent $11.82 over WTI.
The timing matters here. The government’s weekly crude inventory number hit the wire right after the prices in this letter were taken, so nothing in the table above includes any reaction to it. The print:
“US CRUDE OIL INVENTORIES ACTUAL: -3186K VS 922K PREVIOUS; EST 1718K”
“US CUSHING CRUDE OIL INVENTORIES ACTUAL: 444K VS 553K PREVIOUS”
The street expected stockpiles to rise by about 1.7 million barrels and they fell by about 3.2 million instead. That’s a miss of roughly 4.9 million barrels in the bullish direction. Cushing, the delivery hub, still built by 444,000 barrels. What oil does with that number, we’ll find out after this letter is written.
The bank call from earlier in the morning:
“UBS RAISES OIL PRICE FORECAST ON HORMUZ RISKS. UBS raised its December oil forecasts by $5 per barrel, citing declining inventories and escalating attacks in the Strait of Hormuz that have increased the geopolitical risk premium. The bank now sees Brent at $100 and WTI at $96 by”
The post cuts off there.
And the supply relief turns out to be smaller than it sounded. unusual_whales, citing Politico:
“France and Germany say most of the diesel they promised under last week’s G7 deal isn’t new. It will largely come from emergency reserves they already committed back in March, per Politico. Last Friday, the G7 agreed to release 100 million barrels of diesel and oil over four”
That one’s cut off too. Some of last week’s barrels were already counted.
Three more wire items, as they ran: “IRAQ TO SEND HUNDREDS OF TRUCKS A DAY ACROSS SYRIA WITH CRUDE.” “SYRIA PETROLEUM CO: BAGHDAD ASKED FOR HELP TO EXPORT IRAQ CRUDE.” And “IRAN’S PORTS HEAD STATES 90% OF THE COUNTRY’S FOREIGN TRADE TAKES PLACE VIA SEA.” Put those next to UBS’s line about attacks in the Strait of Hormuz and you can see why nobody’s in a hurry to sell crude this morning.
Energy shares aren’t buying it. The energy sector fund is down 0.3% with Brent up 1.1%.
One for the options sellers. The wire also had this:
“*KALSHI FILES PROPOSAL FOR NEVER-EXPIRING OIL CONTRACT WITH CFTC”
An oil contract that never expires. For those of us who make a living off the clock running out, that’s a strange thing to read before lunch.
Bonds Are Getting Hit For Rates, Not For Credit
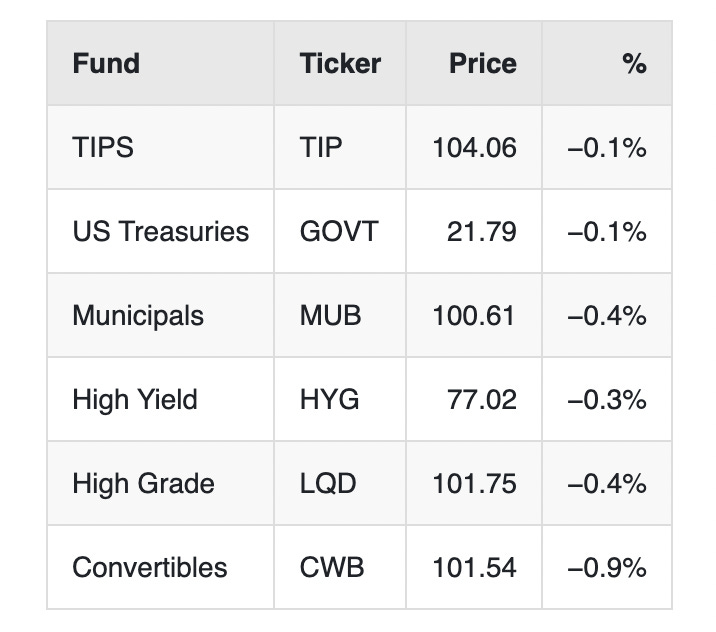
All six are red and none of them is down a full point. Junk, HYG, is off 0.3%. Investment grade, LQD, is off 0.4%. If anybody were worried about companies paying their debts, junk would be doing worse than high grade. It’s the other way round, by a tenth. LQD owns longer bonds, and longer bonds are what’s being sold. Convertibles are worst at 0.9%, which is what you’d expect from the one on this list with stock inside it.
The long end tells you more. TLT, the twenty-plus-year Treasury fund, is down 0.64% this morning at 76.79. Its 52-week low is 76.43. That’s 0.47% away. It’s down 11.90% on the year. GOVT, which holds Treasuries across the whole curve, is off only a tenth. Same government, same morning, very different damage depending on how far out you lend.
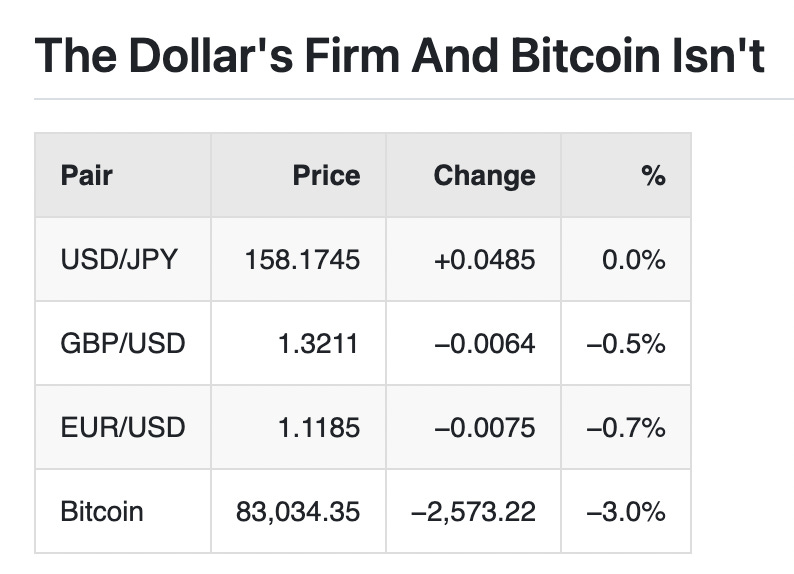
The euro’s down 0.7% against the dollar and sterling’s down 0.5%. The yen is the quiet one: dollar-yen is up 0.0485 at 158.1745, which rounds to 0.0% but is still a hair in the dollar’s favor.
Bitcoin is down 2,573.22 to 83,034.35, off 3.0%. IBIT, the bitcoin fund, is down 3.10%, 33.82% below its 52-week high and down 5.37% on the year. The worst line on the whole watchlist this morning is CRCL, down 5.21% and 49.99% below its 52-week high.
So gold’s down, bitcoin’s down, and the dollar’s up. On a morning when Britain’s thirty-year yield hit its highest since 1998, the market is still choosing the dollar over the things people buy because they don’t trust governments. We find that more interesting than the S&P’s 51 points.
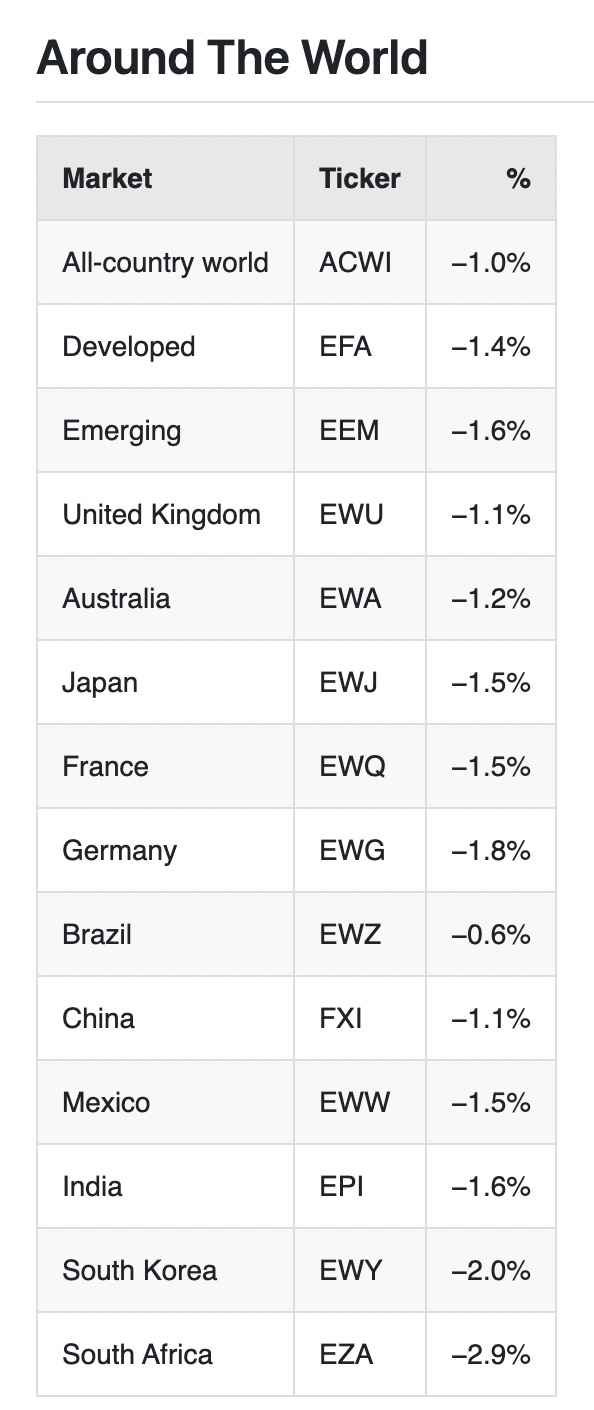
Fourteen funds, fourteen red. Brazil’s the least bad at 0.6%. South Africa’s the worst at 2.9%, with South Korea next at 2.0%. The all-country fund is down 1.0% against SPY’s 0.61%, so this morning the US is holding up better than the world.
Emerging markets are off 1.6% against 1.4% for the developed-market fund, which is near enough a tie. In Europe, Germany’s fund is down 1.8%, France’s 1.5% and the UK’s 1.1%. Japan’s is down 1.5%.
On The Clock Today
Two things on the wire to keep an eye on.
The pre-bell headlines were about traders waiting on the Fed minutes: “US Equity Futures Lower Pre-Bell as Traders Await Fed Minutes,” as one of them put it. A White House official said Trump will announce automatic enrollment for Trump accounts today at 1 PM ET.
Elsewhere, Poland’s central bank held its main rate at 3.75%, as expected.
Bottom Line
Written at mid-morning, off 10:29 AM ET prices, and the afternoon can change any of it. In the order we’d rank it:
Rates are the story. Britain’s thirty-year hit its highest yield since 1998, the US ten-year is 5.322% and the thirty-year 5.698%, and the Wall Street Journal says China is the exception. The number Tony Rihan called “essentially the base interest rate” is 5.322% this morning; on September 24 he flagged it climbing above 5.1%. Housing is where it shows up first: turnover at a 40-year low, according to RPM’s chief executive.
The index hides the damage. The S&P is off only 0.7% and SPY is 0.93% below its 52-week high, but all nine style boxes are red, mid caps are worse than large, only health care and staples are green, and OptionsHawk didn’t see a single positive TICK in the first half hour. BTIG calls it buyer exhaustion. The average stock looks worse than the index.
The AI trade is splitting. Sandisk, Intel and Micron are green; WDC is half off its high; four of the five big spenders Tony Rihan named are red; SpaceX is seeking $40 billion to buy NVIDIA chips, per the FT; Marvell’s boss sees data center revenue that could top $30 billion by 2028. If it’s a capital cycle, as he suspects, that’s what one looks like from the inside.
Gold didn’t get its up day this morning: down 1.6%, with GLD at a 13-month low against SPY, per Heisenberg. And oil was up before the inventory number, which came in as a big draw against an expected build after these prices were taken. We’ll see what crude does with it this afternoon.
Disclaimer
This is not investment advice. Nothing in this letter is a recommendation to buy or sell any security. Grow Your Pile and Squared T Capital publish what we do in our own accounts for education. Options involve substantial risk and are not suitable for every investor. A short put can require you to buy stock at the strike price and can lose more than the premium collected. Past results do not predict future results. Do your own work and consider speaking with a licensed advisor about your circumstances.
Past performance is not indicative of future results, and results shown are those of our own accounts and are not representative of any subscriber’s results. Read the Characteristics and Risks of Standardized Options before trading.
Tony Rihan and Tony Battista Grow Your Pile · Squared T Capital
Every options trade in Portfolio 1 and Portfolio 2 goes out win or lose, with entry, exit and running P&L. Portfolio 3 publishes its full weights. All of it is at growyourpile.com.