


I reviewed this week’s market action with our usual GYP filter: what changed that actually matters for traders and investors heading into next week?
The most interesting contradiction is becoming harder to ignore. Friday’s weak employment report gave stocks a strong finish and substantially reduced expectations for another immediate Fed hike. Yet the 10-year Treasury yield remains above 5%, oil remains around $100, and the extraordinary AI infrastructure boom is increasingly being financed with enormous amounts of capital.
Here are the five stories I think matter most.
The Five Stories That Moved Markets
1 · The Jobs Report Changed the Fed Conversation — Again
Friday delivered the week’s biggest catalyst. The U.S. economy added only 29,000 jobs in September, versus roughly 90,000 expected, while unemployment increased to 4.2%. Previous months were also revised lower. The report dramatically reduced expectations for another Fed hike at the October meeting; markets put the probability of the Fed holding rates steady at about 80% after the report.
Stocks loved it. Friday the Nasdaq 100 gained 1.02%, the S&P 500 0.73%, and the Dow 0.49%, while the Russell 2000 posted its best day in about a month.
Trader Take: We’re back to a market where bad economic news can be good market news—provided it isn’t bad enough to signal recession. The softer labor market removes some Fed pressure and is particularly supportive for rate-sensitive assets. Small caps are worth watching: if yields stabilize and Fed expectations soften, they could benefit disproportionately.
Investor Take: This is close to the Goldilocks outcome markets wanted: slower employment without widespread layoffs. But if subsequent reports confirm a much sharper deterioration, the narrative can quickly shift from “Fed pause” to “economic slowdown.”
2 · The Bond Market Is Sending a Much More Cautious Message
This may actually be the most important story of the week.
The 10-year Treasury yield reached roughly 5.34%, its highest level in about 24 years, before retreating. The 30-year yield also reached levels not seen since 2002.
What’s particularly interesting is that bond yields have been rising even as some inflation and economic data have softened. That suggests the market is worried about something beyond the next Fed decision—government borrowing, inflation risk, global bond supply and potentially enormous capital requirements associated with the AI infrastructure buildout.
Trader Take: I’d keep the 10-year Treasury yield directly beside SPX and QQQ. If yields decisively break above recent highs, I’d become more defensive with long-duration technology. If 5.3% proves to be resistance and yields retreat, growth stocks could get an important tailwind.
Investor Take: A 5%+ risk-free yield changes the valuation equation. Stocks can absolutely continue rising, but companies now need stronger earnings growth to justify premium multiples.
Where it actually closed, and why the title of this letter is a fact rather than a metaphor. The 10-year finished Friday at 5.283% and the 30-year at 5.614%. So “above 5%” isn’t a figure of speech this week. It’s where both of them settled once the dust came off the jobs number.
The level isn’t the story, though. The sequence is. Hand the bond market a soft payrolls print, exactly the kind of number that usually pulls yields down, and the yield did fall on it, then climbed back through where it started and finished the day higher. Amit (@amitisinvesting) wrote it down without decoration: “The ENTIRE move on the 10-year reversed and then went higher for the day.”
Read that again, because it’s the whole week. Weak jobs number, and the bond market closed demanding more yield than it was demanding before the number came out. My story above says the 10-year reached roughly 5.34% and then retreated, and that’s right — it did retreat, to 5.283%. It just retreated to a level above where it began. Both halves are the same fact, and the second half is the one that matters.
A market that wanted the Fed to stop hiking got its reason to believe the Fed will stop hiking, and sold bonds anyway. That isn’t a market waiting on the Fed. That’s a market pricing something the Fed doesn’t control.
3 · Micron Just Told Us the AI Infrastructure Boom Is Still Accelerating
While bonds questioned the cost of all this investment, Micron delivered remarkable evidence that AI demand itself remains extremely strong.
Micron Technology forecast approximately $61.5 billion in fiscal first-quarter revenue, ahead of the roughly $57 billion analysts expected. Customer commitments under long-term agreements climbed to about $32 billion, and remaining performance obligations reached roughly $150 billion as demand for high-bandwidth memory used in AI data centers continues to surge.
U.S. equity funds subsequently attracted $20.6 billion for the week through September 30, marking a second consecutive week of inflows, with AI optimism helping offset concerns about bond yields.
Trader Take: AI leadership is broadening. Don’t look only at NVDA. Memory, storage, networking, power generation, cooling and data-center infrastructure increasingly offer ways to participate in the buildout. I’d look for relative strength on market pullbacks rather than chasing vertical rallies.
Investor Take: Micron’s numbers strengthen the argument that AI infrastructure demand is real. But there’s a second question investors increasingly need to ask: who ultimately earns an attractive return on all this spending? That’s likely to become one of the defining investment questions of 2027.
4 · Oil Stayed Above $100 — But the Story Became Even More Complicated
Energy remained one of the market’s major macro variables. Oil jumped more than $4 per barrel Thursday after reports of additional U.S. military deployments to the Middle East and China’s suspension of petroleum-product exports raised concerns about global fuel shortages.
Friday brought some relief after European governments agreed to release diesel reserves. Brent finished around $102.25, while WTI settled near $91.11.
This is important because oil isn’t simply an energy trade anymore. It affects inflation → Fed policy → Treasury yields → equity valuations.
Trader Take: I’d be reluctant to chase crude itself because one diplomatic headline can produce a huge reversal. Energy equities may offer cleaner opportunities on pullbacks. Also watch airlines, transports and consumer discretionary companies if fuel costs remain elevated.
Investor Take: Persistent $100 Brent is effectively a tax on the global economy. If oil begins trending sustainably lower, it could become one of the most bullish macro developments for equities because it would simultaneously help inflation, consumers and the Fed.
5 · Stocks Finished an Extraordinary Q3 — Now Earnings Have to Justify It
This week’s biggest-picture story may be what didn’t happen.
Government bond yields surged to multi-decade highs. Oil remained above $100. The Fed already raised rates. Geopolitical risk remained elevated.
And yet equities remained remarkably resilient. The S&P 500 enters Q4 up nearly 13% for the year and close to record territory.
Now fundamentals get another test. Third-quarter earnings season is beginning, and current estimates point to S&P 500 earnings growth above 30% year over year.
Trader Take: Earnings reactions may tell us more than the earnings themselves. If companies beat estimates and stocks can’t rally, expectations may already be priced in. If stocks absorb high yields and still rally on strong results, the underlying bid remains powerful.
Investor Take: This is where valuation discipline becomes critical. At today’s yields, good earnings may not be enough. Companies need strong earnings, strong guidance and credible returns on capital—particularly those spending enormous sums on AI.
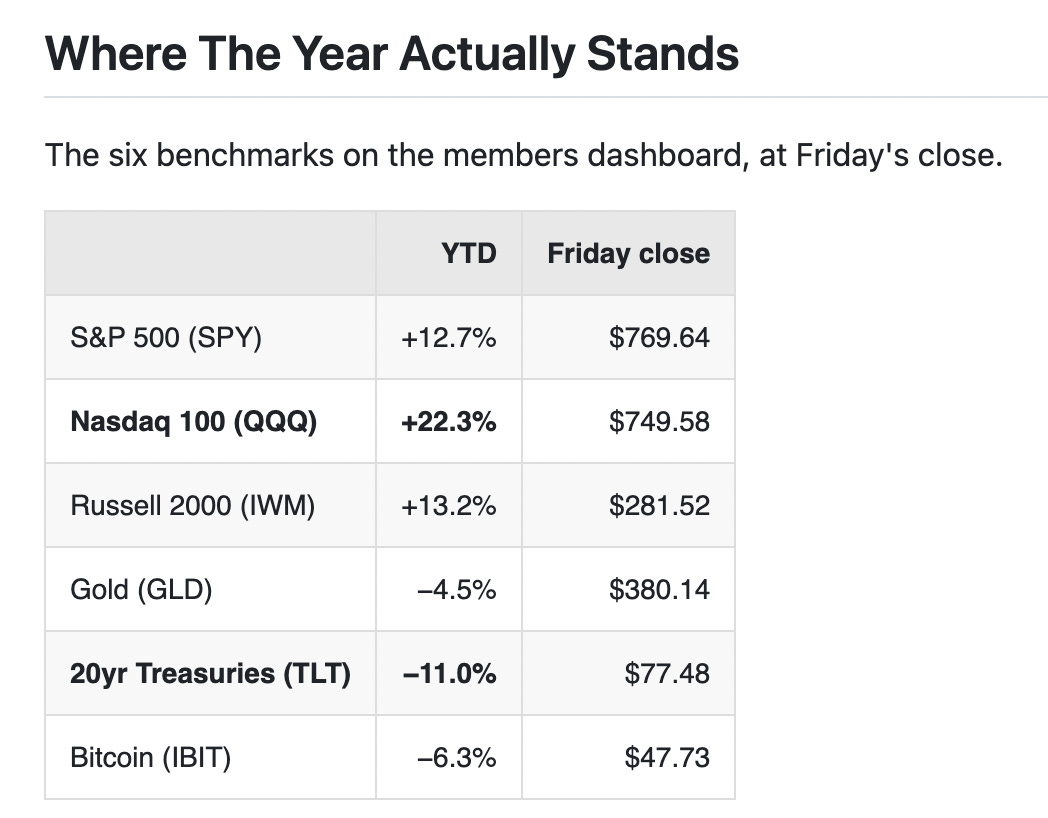
Twenty-two points of upside in the Nasdaq 100 and eleven points of downside in long Treasuries, in the same year, is the cleanest picture of this market I can give you in two rows. Growth equities and the price of money went in opposite directions and neither one blinked.
Now the number behind “close to record territory” in my fifth story, because a phrase can’t be checked and a number can. QQQ closed 0.66% under its 52-week high. SPY closed 1.25% under its own. Notice which one is nearer: the index that’s up twenty-two on the year is closer to its high than the index that’s up thirteen. Leadership hasn’t rotated. It’s just been quieter about it.
The VIX closed at 15.33. A jobs miss, Brent over $100 and a bond market that closed the day asking for more yield, and the options market still charges a fifteen handle for protection. I’m not going to argue with it. I’m going to notice that it’s cheap relative to the list of things that could go wrong, which is a different statement from saying it’s wrong.
One more thing about Friday, and it’s the part I keep coming back to. Friday was a round trip in three different markets, and stocks weren’t one of them. The 10-year gave its drop back and closed higher. Bitcoin ran toward $87,000 on the print and finished at $84,523. Gold went the wrong way too — Doug Kass was posting about that one while it happened, and his words are further down this letter. Equities were the only market that kept what the jobs number handed them.
I’m not claiming one of those caused another. I’m saying that when three markets hand the gift straight back the same afternoon and one keeps it, the one that kept it is the one making an assumption. That assumption may be correct. It’s still an assumption, and it’s worth knowing you’re carrying it.
Trader Take: QQQ 0.66% from its high with a 15 VIX is a thin cushion and a cheap hedge in the same sentence, which is unusual enough to act on. If you’re selling premium up here, sell it short-dated and keep the strikes honest. The thing that breaks this tape isn’t an earnings miss, it’s a 10-year that keeps closing higher on good news for stocks.
Investor Take: TLT down eleven on the year is not a bond problem, it’s a discount-rate problem, and it lands on every long-duration asset you own including the ones in your equity sleeve. If your portfolio’s performance this year came from the Nasdaq 100, you are long duration whether or not you own a bond. Size for that before you decide whether you’re comfortable.
What We Actually Did
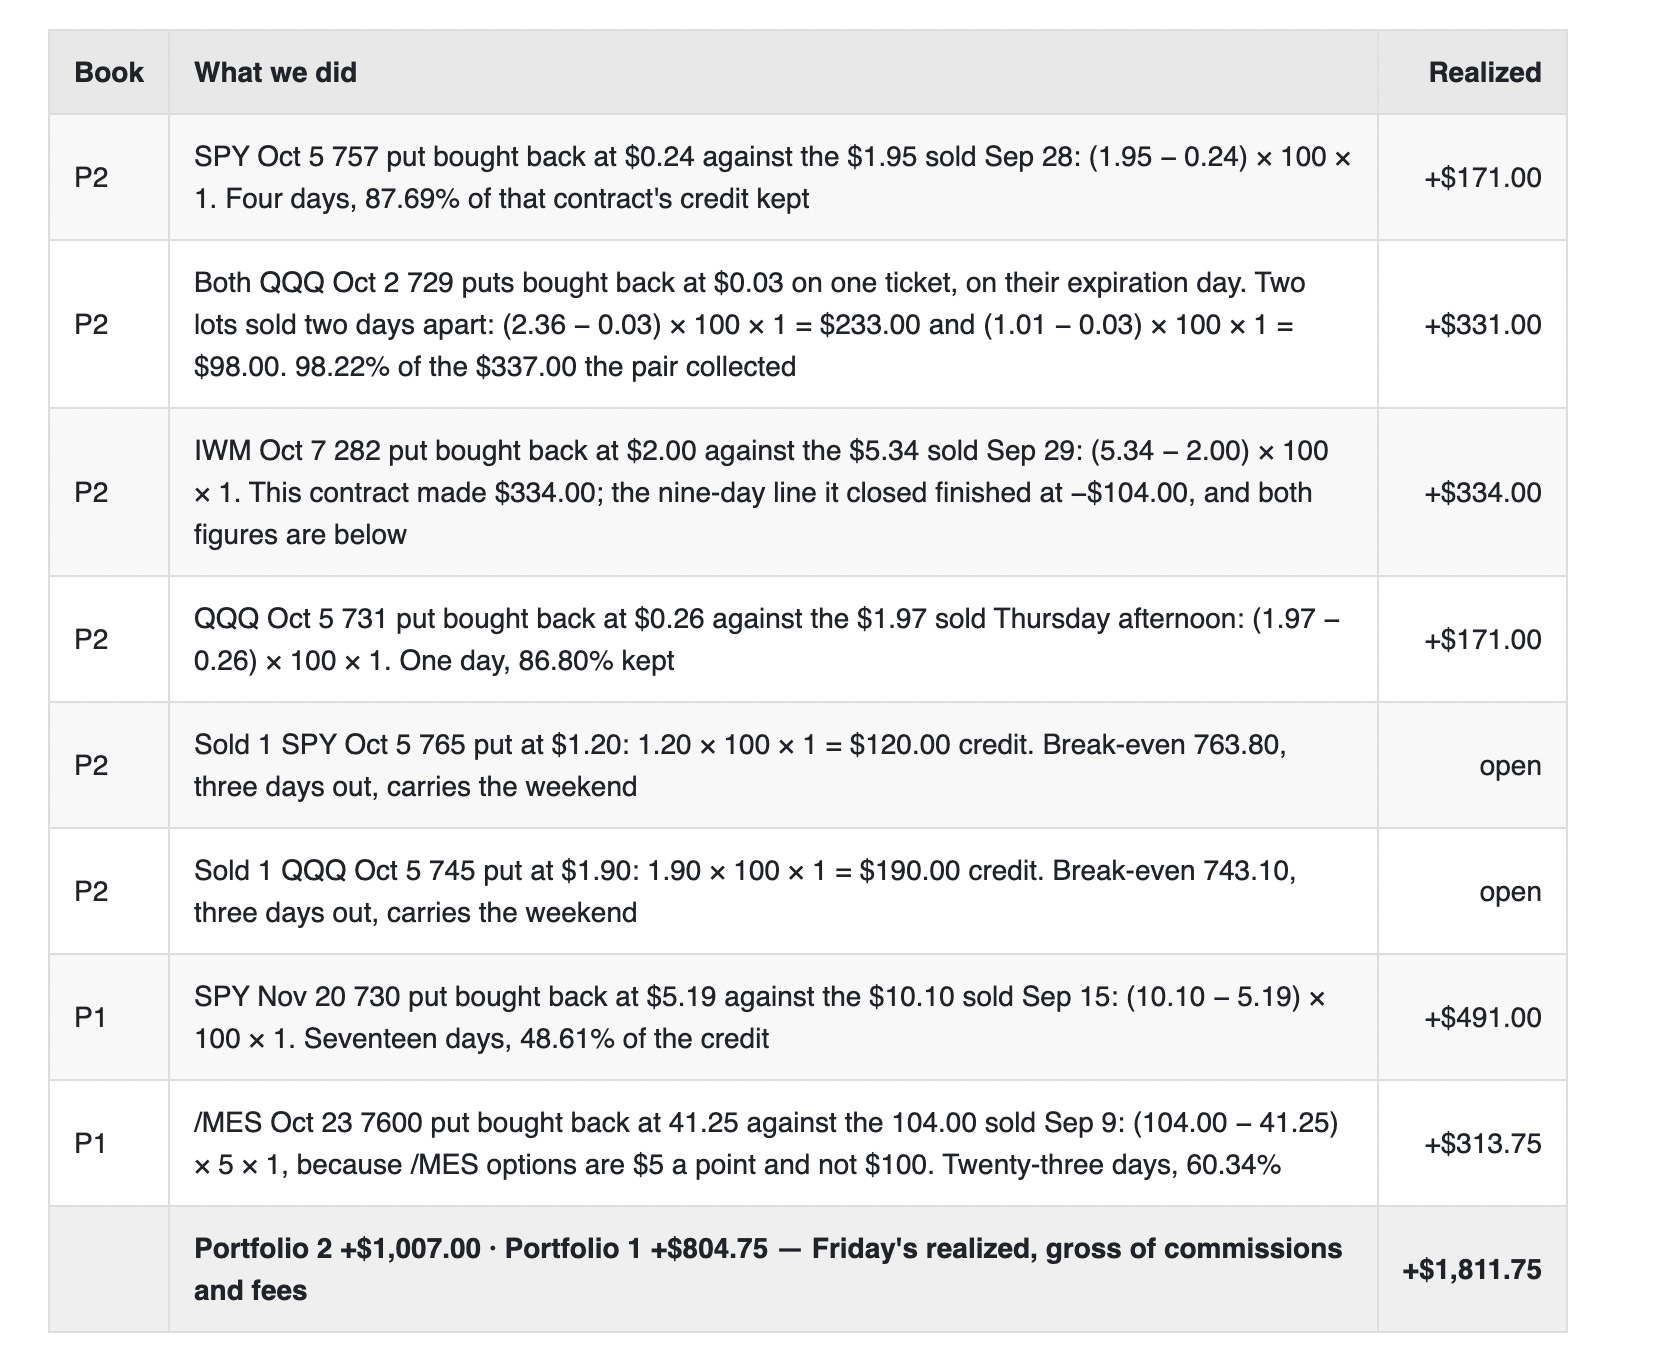
This section covers Friday only, and I want to be straight about that up front. Nine alerts went out Monday through Thursday as things happened, including Portfolio 3 going to zero on Wednesday and getting rebuilt on Thursday, and every closed line from those days is on the closed-trade page at the members site. What follows is Friday, all eight tickets of it.
Eight tickets across the two option books. Seven short puts bought back for $1,811.75 of realized profit, gross, and two new three-day puts sold into the weekend for $310.00 of credit.
Portfolio 3 has been a different animal since Thursday. It went to zero on Wednesday and came back on Thursday as a weights-only model: eleven positions, allocations that sum to exactly 100%, and no dollar figures anywhere. That last part is on purpose. If the model is published in percentages, the size of your account doesn’t decide whether you can follow it.
Its first day is +0.61% on the weights.
Trusted Voices
Four voices this week, four different lenses, all of them in their own words. Their figures are theirs, not ours — we’re quoting them, not re-measuring.
Charlie Bilello, Chief Market Strategist at Creative Planning, read Friday the opposite way the market did, and that disagreement is the most useful thing in this letter.
“US gas prices at $4.41/gallon are the highest level ever seen in October and up 40% over the last year. The Cleveland Fed is forecasting a 3.6% print for September CPI. That will mark the 67th consecutive month above the Fed’s 2% target. More rate hikes are coming.”
Sit with how far that is from the tape. My first story has the market putting the odds of a Fed hold at about 80% after the payrolls number. He finished his post with “More rate hikes are coming.” Both of those are in this letter deliberately. One of them is wrong and nobody reading this knows which yet — and if your positioning only works if Bilello is wrong, that’s worth knowing before the October meeting rather than after it.
He also planted a flag on the recession that keeps not arriving: “It’s now been 4 years since the US yield curve inverted. Still waiting on the recession...” Four years inverted and no recession either means this cycle rewrote the rulebook, or it means the clock just runs slower than it used to. I don’t think anyone has earned the right to be smug about which one it is.
Liz Ann Sonders, Chief Investment Strategist at the Schwab Center for Financial Research, supplied the line of the week, and it isn’t the headline number.
“Two-month net revisions to nonfarm payrolls subtracted 60,000 jobs”
September created 29,000 jobs. The two months behind it lost 60,000 in the rewrite. Those are different windows, one month against two, but the arithmetic still lands hard: the revisions took away more than twice what the headline month put on. If you want to know why the bond market refused to celebrate a weak jobs report, start right there. The report wasn’t just soft. The reports behind it got softer after the fact.
She also posted two internals that argue with each other, which is the honest shape of this release:
“September prime age labor force participation rate rose to 83.7% vs. 83.4% prior”
“In September, job leavers as % of unemployed dropped to 10.5% vs. 13.1% in prior month”
Participation rising says people are coming into the workforce rather than being pushed out of it. Job leavers falling says fewer people feel confident enough to quit a job voluntarily. Those two describe different labor markets. My own Investor Take above called this “close to the Goldilocks outcome” — her numbers are why the words “close to” are doing real work in that sentence. Mixed is the honest word, not Goldilocks.
Danielle DiMartino Booth, CEO of QI Research and formerly of the Fed, was on credit all week, and her post is the one I’d set beside the AI-financing question in my Bottom Line.
“(Risk not) ‘one giant bank failing…it would be a refinancing window closing for weaker corporates, w/private credit & bank funding lines becoming transmission mechanism…visible bankruptcy would come later. The first real sign would be financing that suddenly cannot get done.’”
The inner quotation marks are in her post. I can’t tell from the feed whose passage she’s setting off, so read it as the point she’s advancing rather than a sentence I can put in her pen. Either way, it’s the right mechanism to watch, and it’s the opposite of what most people are watching for. Nobody rings a bell. A deal just quietly doesn’t get done, and then another one doesn’t.
She put the American version of it plainly in her own words:
“In the U.S., CRE loss realizations are the transmission mechanism to a fanning out to tightening lending standards.”
There’s a third idea she amplified without writing it herself, so I’ll put it in my own words rather than hers: if credit tightens on its own, it does the job another rate hike would have done. That’s the bridge between Bilello’s “more rate hikes are coming” and the market’s 80% odds of a hold. They can both be right. The tightening just might not arrive from the Fed.
Doug Kass of Seabreeze Capital was watching the cross-asset tape, and to his credit he asked the question instead of announcing the answer:
“Is this a negative market tell? The weakness in gold — from $385 to $381 — is surprising considering the jobs data and the softness of the US dollar. (A similar reversal just occurred with $TLT from $78.32 to $77.75.)”
It’s a question and I’m leaving it a question. His levels are his own and they don’t tie to the closes in my table above, on either name.
Later in the week:
“The lower moves in gold and bonds that I brought up continues. Now bitcoin is flushing lower. Caveat emptor.”
Gold, bonds and bitcoin all going the wrong way on a day stocks rallied on bad news is the same pattern I flagged earlier in this letter, and he was tracking it live while it happened. It’s also Portfolio 1’s GLD structure in a single sentence.
Bottom Line
I think this week’s market can be summarized by one contradiction:
The economy is slowing just enough to help stocks — but the bond market still isn’t convinced inflation and borrowing are under control.
For traders, I remain constructive, but this isn’t an environment where I’d want maximum buying-power utilization. Friday’s move reinforces the positive trend, and weaker employment reduces immediate Fed risk. But with the 10-year above 5% and oil around $100, I want positive delta with plenty of dry powder rather than chasing the market.
For investors, AI remains an extraordinary secular growth story, and earnings remain remarkably strong. But the hurdle rate has changed. Cash flow, balance-sheet quality, earnings growth and return on invested capital matter much more when Treasuries yield 5%+.
And one under-the-surface issue deserves watching: the enormous AI buildout is increasingly intersecting with the credit markets. Danielle DiMartino Booth’s post this week carried the line I keep coming back to on this: “The first real sign would be financing that suddenly cannot get done.”
That doesn’t mean the AI boom is ending.
It means 2027 may increasingly become about proving the return on the AI investment.
My headline for this week’s GYP report:
JOBS BLINKED. BONDS DIDN’T. — THE MARKET’S NEXT BIG TEST
Disclaimer
This is not investment advice. Nothing in this letter is a recommendation to buy or sell any security. Grow Your Pile and Squared T Capital publish what we do in our own accounts for education. Options involve substantial risk and are not suitable for every investor. A short put can require you to buy stock at the strike price and can lose more than the premium collected. Past results do not predict future results. Do your own work and consider speaking with a licensed advisor about your circumstances.
The SPY October 5 765 put and the QQQ October 5 745 put sold on Friday are uncovered short puts and both remain open, so their outcomes are unknown, and Portfolio 2 holds no SPY or QQQ shares against either one. The Portfolio 1 GLD legs described above are open positions valued at the broker’s marks, not closed trades, and the $1,817.00 figure is an unrealized mark that will change with the price of gold. Rolling a position out in time does not reduce the risk, does not cut the size and does not turn a losing leg into a winning one; the IWM line above shows a final contract that made $334.00 inside a nine-day line that lost $104.00. Portfolio 3’s +0.61% is the allocation-weighted return of a published model portfolio; it is not an account return, no dollar amounts or share counts are published for it, and a member’s own result depends on when and at what prices they allocate. Every dollar figure in this letter is gross of commissions and fees; no export we hold carries fee data for these fills. Margin requirements vary by strike, expiry, volatility, broker and margin regime — our accounts run portfolio margin, and your own broker’s number is the one that matters.
Past performance is not indicative of future results, and results shown are those of our own accounts and are not representative of any subscriber’s results. Read the Characteristics and Risks of Standardized Options before trading.
Tony Rihan and Tony Battista Grow Your Pile · Squared T Capital
Every options trade in Portfolio 1 and Portfolio 2 goes out win or lose, with entry, exit and running P&L. Portfolio 3 publishes its full weights. All of it is at growyourpile.com.