


We have told you three different things about crude in three days. Today’s is the one that matters.
Wednesday we led on crude gapping five dollars lower, on barrels physically returning from South Pars. Thursday morning we told you a Black Sea tanker strike had put a bid back under it. Thursday WTI closed up 3.3% and Brent up 4.2%. Then, overnight, a drone attack damaged the Novoshakhtinsk oil refinery in Russia’s Rostov region, Russia said it had continued strikes on Ukrainian logistics and vessels, and an explosion was reported near central Kyiv.
US crude futures are down 2%.
Read that sequence in the order it arrived, because the order is the point. The refinery headline crossed first. The vessel strikes came after it. The 2% decline printed after both. Supply got hit and the barrel fell.
That is a market that has stopped paying for supply risk. It doesn’t mean the risk went away. It means the bid that was there twenty-four hours ago isn’t there this morning, and anyone who was long the story rather than the barrel found that out while they were asleep.
Not advice — full disclaimer below.
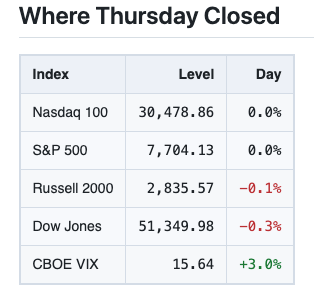
Essentially nothing happened to the S&P on Thursday. It finished at 7,704.13, less than two points below where Wednesday left it, and the Nasdaq 100 finished eight and a half points higher than Wednesday. The Dow gave up 161.61 points and the Russell barely moved.
The VIX went up about 3% anyway, to 15.64. That’s two sessions of gains now: 14.20 Tuesday, 15.17 Wednesday, 15.64 Thursday. Volatility got more expensive on a day the index didn’t go anywhere. Remember the 15.64. It is the number that decides whether any of this is worth selling into.
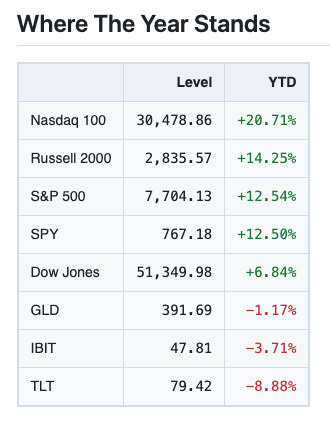
SPY is in that table at 767.18 and up 12.50% on the year, which is the S&P’s own 12.54% to within four hundredths of a percentage point. Just under fourteen points separate the Nasdaq 100 from the Dow. The long bond is down 8.88%.
September inside those same rows is three different markets. QQQ is up 3.40% month to date. SPY is up 0.02%. IWM is down 4.17%. That is more than seven and a half points of spread between big technology and small caps in under four weeks, with the index sitting flat in the middle of it, and it is the reason a chart of the S&P tells you almost nothing about what your account did this month.
One more from the leaderboard, because we wrote about it yesterday. NVDA had essentially matched the index it lives in. After Thursday it is behind it. NVDA’s year is 20.42%. The Nasdaq 100’s is 20.71%. The two big year-to-date numbers underneath are unchanged in character, SNDK up 638.74% and MU up 278.59%, and SNDK fell 3.47% Thursday while MU rose 0.81%. IBIT is up 10.42% over the past week, still down 3.71% on the year, and still 33.43% below its fifty-two week high. All three of those are true at once, which is the problem with describing that asset in one sentence.
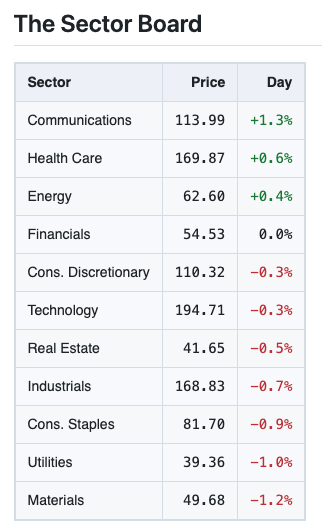
Three sectors closed green. On Wednesday exactly one did, and it was Energy. Financials finished flat and the other seven were red, so this is not a rally, but it is a tape that stopped falling.
Communications led, up 1.3%, after losing 0.9% Wednesday. Health Care added 0.6%. Energy was green for a second day, up 0.4%, with WTI closing up 3.3% behind it. Energy is also the sector this morning’s crude print lands on.
The two bond proxies split, which is worth noticing given what yields did. Utilities fell another 1.0% on top of Wednesday’s 1.9%. Real Estate was the second worst sector on the board Wednesday, down 1.6%, and only gave up 0.5% Thursday. Materials was the weakest sector of the eleven, down 1.2%.
Overseas the same thing happened, only less of it. The France and UK ETFs closed higher in New York, Germany’s finished flat, and the other eleven rows on the global board were red. Wednesday all fourteen were red.
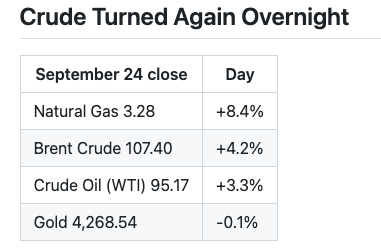
Every price in that table is Thursday’s close, including natural gas, which was the largest move on it. The 2% decline in US crude futures is First Squawk’s print from this morning. We are not converting it into a level, because their 2% and Thursday’s 95.17 are not measured from the same place.
Brent’s premium over WTI finished Thursday at $12.23. In yesterday’s letter we put it at $10.94 on live quotes taken before Thursday’s open. It widened through the whole session, which is what you get when the threat is to moving barrels rather than to producing them.
Which is why this morning is interesting rather than just noisy. The threat to moving barrels got worse overnight, not better. Russia said it struck vessels. The Financial Times reported that Russia is expanding its shipping fleet as pressure on stateless vessels mounts. If you want a reason the tape shrugged at a damaged refinery, that piece is a candidate: the barrels are finding boats.
HSBC raised its BP price target to 640p from 570p and its Chevron target to $250 from $218 this morning, into a crude tape that had already turned. Those are their numbers and their call, not ours.
One thing to keep straight before we go on. Every index, sector, global-market ETF, individual stock and ETF and fixed-income figure in this letter is a Thursday, September 24 close unless another date or session is named in the same sentence, and so is every price in the commodities table above and the Brent premium derived from it. The sovereign yields further down are each market’s most recent close. The crude decline, the two Japanese government bond yields and the Japanese sales figures are First Squawk prints from the pre-market hours of Friday, September 25, and those move continuously, so they will not be what they were when we wrote them down. WTI closing up 3.3% Thursday and US crude futures down 2% this morning are not a contradiction. They are two measurements of two different moments.
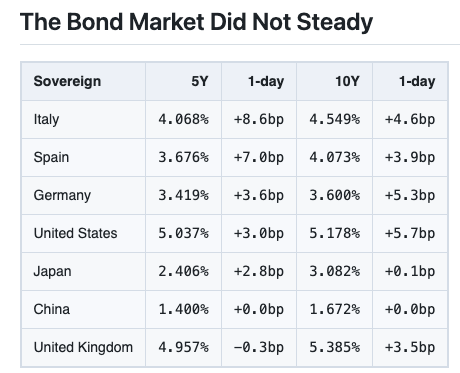
Equities took a breather. Fixed income did not.
The United States ten-year rose another 5.7 basis points to 5.178%, and nothing else on the board rose more at that tenor. Germany added 5.3, Italy 4.6, Spain 3.9, the UK 3.5. Japan’s ten-year moved a tenth of a basis point, which is tiny, but it is still up.
At the front of the curve it was Italy’s turn. Italy’s five-year rose 8.6 basis points, the biggest single move on the table at either tenor. The UK’s five-year was the only yield on the board that fell, and it fell three tenths of a basis point.
That is a straight swap from Wednesday, when the United States led at the front and Italy led at the back. Thursday it was the other way round.
The pace did slow. Our ten-year rose 15.1 basis points Wednesday and 5.7 Thursday. Slower is not the same as finished, and the shape changed while it slowed: our own five-year and ten-year are 14.1 basis points apart now against 11.4 Wednesday, because the long end sold off harder than the front. That is still a rounding error for five extra years of duration, but it is a bigger rounding error than it was.
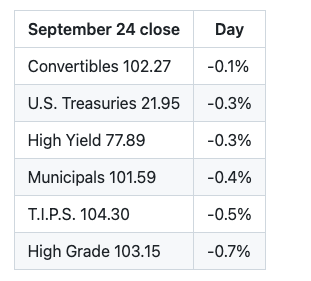
All six red for a second day running, and the same one is at the bottom. High grade lost more than high yield again, 0.7% against 0.3% Thursday after 1.1% against 0.7% Wednesday. Convertibles went the other way entirely, from second worst on Wednesday to best on Thursday, which is what happens to the instrument in that list with equity in it when equities stop falling. Credit is not what is breaking. Duration is. TIPS fell again, so real yields are still going up, not just inflation expectations.
Then there is TLT. It closed Thursday at 79.42. Its fifty-two week low is 79.42. The same number. Down 1.29% on the day, 3.76% on the month, 8.88% on the year, and finishing the session at the lowest close it has made in a year. When the tape steadies and the longest-duration instrument on it prints a new low, the steadying is not happening in the part that matters.
Japan
Japan is the quiet one, and it is getting less quiet.
First Squawk had the two-year JGB at 1.950% this morning, up 5.0 basis points, and the five-year at 2.410%, up 3.5. Both of those moves are their measurement, not ours. Japan’s five-year closed Thursday at 2.406%, up 2.8 basis points on the session. Four thousandths of a percentage point between a Thursday close and a Friday morning print is about right.
Then the demand side of the same country. August department store sales came in at 2.6% year over year nationwide, against 5.1% the month before. Tokyo’s were 5.7% against 9.0%. Sales are still growing in both. Nationally they are growing at about half the rate they were a month ago, and Tokyo’s growth is down by more than a third.
Rising yields on one side and consumption decelerating on the other is the combination nobody wants to own, and the equity market took the point. The Japan ETF fell 1.3% in New York on Thursday. Only South Korea’s fell more.
What Else Crossed
JPMorgan cut its Constellation Brands price target to $133 from $165, about 19% off, in the same few hours as Japan’s nationwide department store sales growth roughly halved. Two data points on two continents are not a trend. They do point the same way.
Jefferies lifted GoDaddy to $100 from $85. The EU called on the UK to raise tariffs on Chinese cars, per the FT. Credit Suisse reached a settlement with an Australian insurer over Greensill, also the FT, which is a sentence that has been around a while now.
An explosion was reported near central Kyiv during a Russian drone attack, per a Reuters witness on the scene.
Trusted Voices
Jeffrey Gundlach (@TruthGundlach), September 24
“The dilemma: If the Fed hikes it will worsen the interest expense problem (since so much borrowing is at the short end). If the Fed cuts it will worsen the inflation problem.”
That is the box, and it is a real box. The part people skip is the parenthesis. The interest expense problem lives at the short end, which is where the refinancing actually happens, and our five-year closed Thursday at 5.037%. There is no cheap end of this curve to roll into.
Ben Carlson (@awealthofcs), Thursday morning
Treasury yields, March 2020 against today, as he posted them:
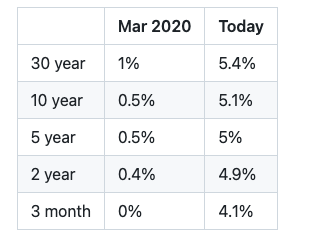
Two things. His “today” column sits right on top of Thursday’s closes above: his ten-year 5.1% against 5.178%, his five-year 5% against 5.037%.
And he carries two tenors this letter does not. Thirty year 5.4%, three month 4.1%. Those are his figures and we are not adopting them as ours. On his numbers the curve slopes up the whole way out, which set against his own March 2020 column is a different financial world, not a different year.
Hugh Hendry (@hendry_hugh), this morning
“the 25 is the signal. if the fed wanted to fight inflation, it had 50 and 100 available. it chose an alibi.”
Those are his words and his read. We will write about the Fed when we have it properly sourced.
The Bottom Line
Two things happened in the same twelve hours and they are the same thing.
A refinery got hit, vessels got hit, and crude went down 2%. The S&P did not move, and the VIX went up about 3%. One market refused to pay for a risk that actually showed up. The other paid up for a risk that did not.
What both of them are pricing is the cost of money, and that price is still going the wrong way. The ten-year rose another 5.7 basis points Thursday to 5.178%. High grade lost more than high yield for a second day. TLT closed at its fifty-two week low. None of that is about geopolitics and none of it is about earnings.
For anyone selling premium into this, the arithmetic has not improved. A 15.64 VIX is still a fifteen handle, and a fifteen handle is thin pay on a tape where the long end is making new lows. Thin pay is an argument about strike selection, not an argument for sitting on your hands.
Crude is the one to watch today. If the barrel cannot rally on a damaged refinery and struck vessels, find out what it does rally on before you size anything to it.
Disclaimer
This is not investment advice. Nothing in this letter is a recommendation to buy or sell any security. Grow Your Pile and Squared T Capital publish what we do in our own accounts for education. Options involve substantial risk and are not suitable for every investor. A short put can require you to buy stock at the strike price and can lose more than the premium collected. Past results do not predict future results. Do your own work and consider speaking with a licensed advisor about your circumstances.
Index levels, year-to-date figures, sector moves, global-market ETF moves, individual stock and ETF moves, fixed-income figures and the commodity prices in this letter are September 24, 2026 closing figures unless another date or session is named in the same sentence, and are gross of any subsequent revision. The Brent premium over WTI at the September 24 close is derived from those closing prices; the $10.94 figure is the one we published on live quotes taken before the open on September 24, 2026. Sovereign yields are each market’s most recent close and the changes shown are one session. The 2% decline in US crude futures, the two-year and five-year Japanese government bond yields and their basis-point changes, and the Japanese department store sales figures are First Squawk prints from the pre-market hours of September 25, 2026 and will have moved by the time you read this; they are not September 24 closing figures. Headlines, analyst price targets and quoted comments are reproduced from wire and public feeds; we quote them as published and do not paraphrase them into views their authors did not express. The Treasury yield figures in Ben Carlson’s table, including the thirty-year and three-month yields, which this letter does not otherwise carry, are his and not ours. Commentary attributed to Jeffrey Gundlach, Ben Carlson and Hugh Hendry is their own and is not our recommendation. Hendry’s post concerns a Federal Reserve decision; we reproduce his words as posted and make no statement of our own about any Federal Reserve action.
Past performance is not indicative of future results, and results shown are those of our own accounts and are not representative of any subscriber’s results. Read the Characteristics and Risks of Standardized Options before trading.
Tony Rihan and Tony Battista Grow Your Pile · Squared T Capital
Every options trade in all three portfolios is published, win or lose, with entry, exit and running P&L at growyourpile.com.