


The Ten-Year Has A Five In Front Of It
That’s the number. If you only keep one line from this letter, keep that one.
5.011% this morning. The last ten-year we published was 4.953%, and that was Thursday’s close, with Friday and Monday traded in between. So call it about six basis points over three trading days rather than a dramatic session. The move is small. The handle isn’t. A five in front of the ten-year reads differently from a four, and markets are run by people who read.
Stocks are lower, but not in a way that should make anybody do anything. The S&P is off 0.3%, the Nasdaq 100 the same, the Dow 0.8%. The VIX is 17.43. That’s a Tuesday.
The part worth your attention is underneath the indices. Ten of the twenty-two names on our board are green on a morning when every index is red, five of the six chip names are up, and the worst of the eleven sectors is technology. Those three things are all true at once and we’ll come back to them.
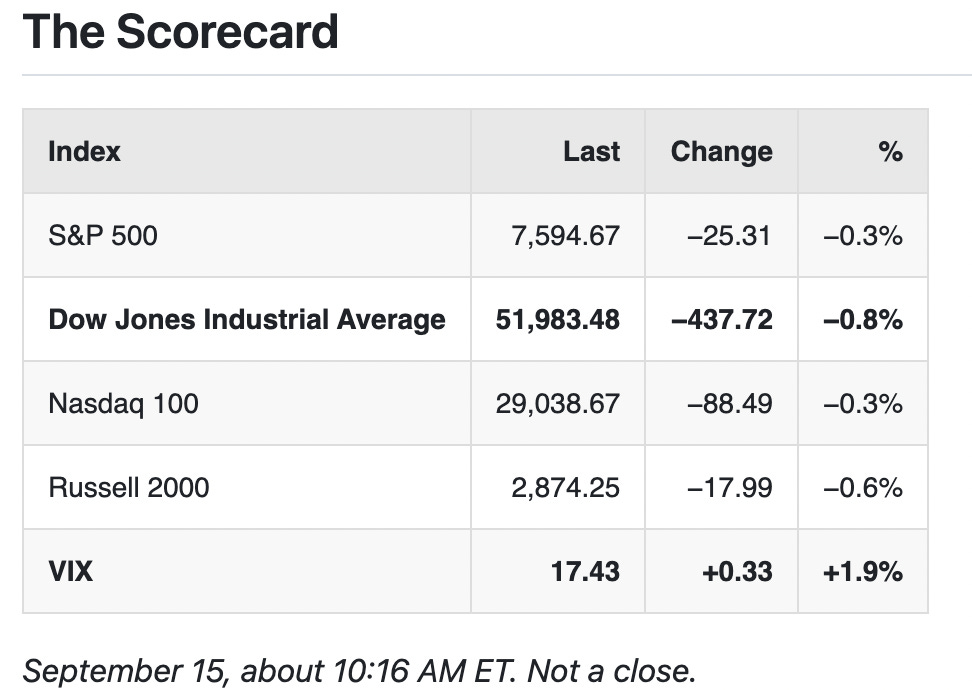
Four indices red, and the Dow is doing most of the visible damage at 0.8%. That’s half a point more than the S&P. We’d be careful reading much into it: the Dow is thirty stocks and it’s price-weighted, so it tells you about thirty stocks. The more useful contrast is the Russell at 0.6% against the S&P at 0.3%, which says the smaller end is giving up a bit more this morning than the large end.
The VIX is up 1.9% to 17.43. We published 18.01 at Thursday’s close, so vol is sitting lower this morning than it was then, with the ten-year through five in the meantime. Seventeen and change is inside the fourteen-to-twenty band we’d call ordinary. That’s a reading, not a forecast, and it’s a mid-morning print being compared to a Thursday close.
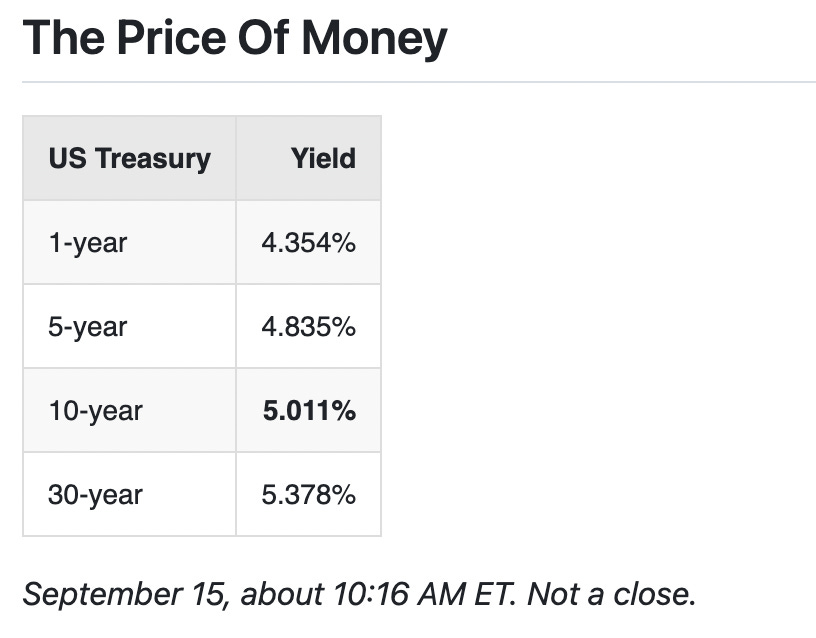
The curve slopes up the whole way, 4.354% at the one-year out to 5.378% at the thirty. What’s thin is the long end. There are only thirty-seven basis points between the ten-year and the thirty-year, so you’re being paid almost nothing to take twenty extra years of duration. That’s usually the part that hurts when it corrects.
Treasury Secretary Bessent was asked about rising bond yields today. He put the move down to “global issues”, and when the question narrowed to the ten-year specifically, he pointed at the rise in the oil price. He also said the administration has “set the table for a robust economy.” That’s the official explanation on the record, from a named person, on the day. We’re reporting it, not grading it. But the oil answer is testable against the next table, so hold it for a second.
Now look abroad, because it isn’t only us.
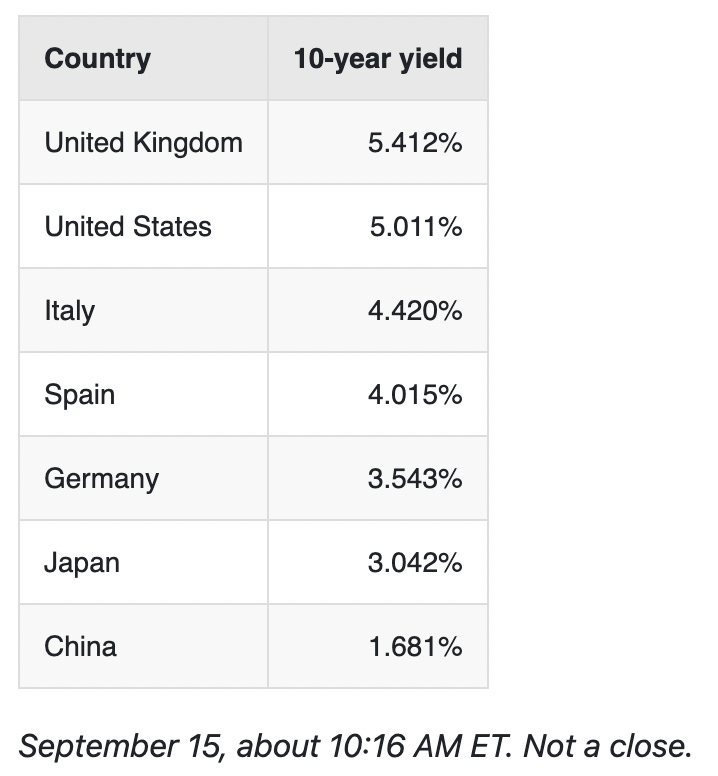
Britain is the outlier at the wrong end, forty basis points above the United States, and the UK thirty-year is at 5.949%. That’s a little over five basis points short of six percent. Italy at 4.420% sits nearly eighty-eight basis points above Germany, which is the spread that used to make headlines.
Japan is the shape worth noticing. The ten-year is 3.042% and the thirty-year is 4.154%, so a hundred and eleven basis points of slope between the two. Ours is thirty-seven. Japan’s long end is being repriced in a way ours isn’t, and if you’ve been trading for twenty years the idea of a 3% JGB still reads as a typo.
China is the only market on that list that isn’t part of this story at all, at 1.681%.
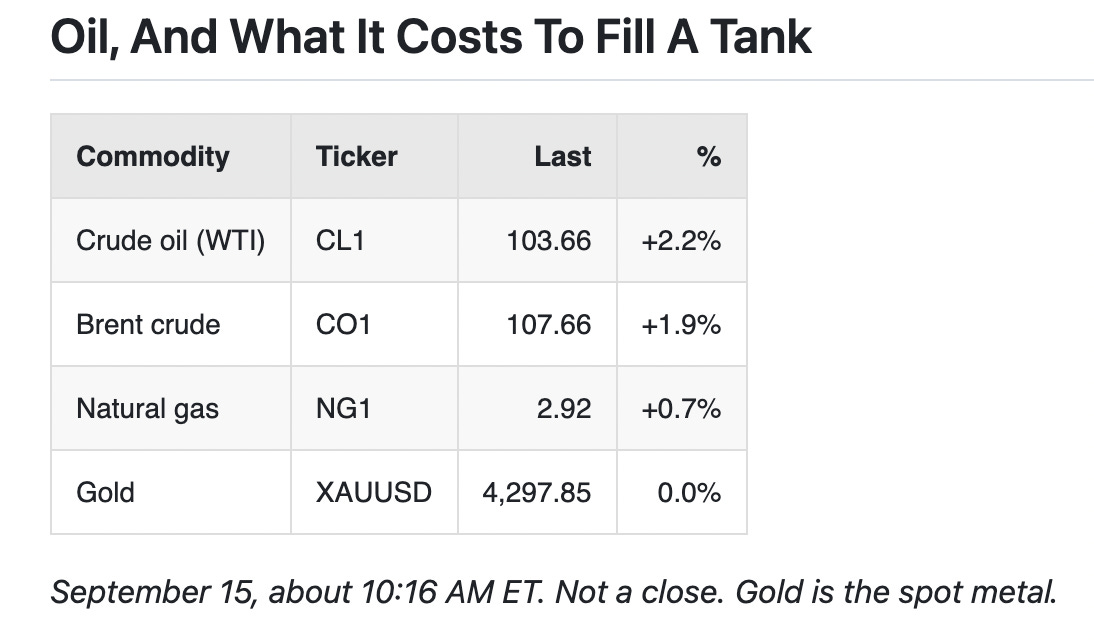
Crude’s up 2.2%, Brent 1.9%, and the spread between them is exactly four dollars. Two supply headlines came across the wire today. Libya’s National Oil Corporation may declare force majeure, with output halted at Hamada and Al-Tahara after a pipeline closure. And Saudi Arabia is reported to have cancelled September crude cargoes to some European refiners after damage to the East-West pipeline. We’re passing those on the way they came in. We’re not going to tell you they caused a 2.2% move, because we can’t show you that, and neither can anyone who says it with more confidence.
The part of this that reaches people who don’t own a single barrel is at the pump. On the week, regular gasoline is up 16.2 cents to $4.319 a gallon, and it’s $1.151 higher than a year ago. That’s a 36% increase off a $3.168 base. Diesel is worse: up 31.8 cents on the week to $6.285, and up $2.546 year over year, which is 68% off a $3.739 base. The wire also has US diesel futures near $5.23 a gallon, the highest since 2022. Futures and the pump are two different prices and we’re not mixing them, but they’re pointing the same direction.
Diesel is what moves everything you buy. When that number is up 68% in a year, the Treasury Secretary’s answer about the ten-year stops sounding like a deflection and starts sounding like a description.
And then there’s gold, which is unchanged. Zero point zero. Crude is ripping, the pump is on fire, the ten-year is through five, and the metal people own precisely for this did nothing this morning. The ETF is a fraction higher at +0.16%, and it’s down 3.66% this month and 0.72% on the year. We wrote almost this same paragraph on September 10, when gold fell 1.7% on a day crude ran 6.9%. Twice in four sessions is a pattern worth sitting with rather than explaining away.
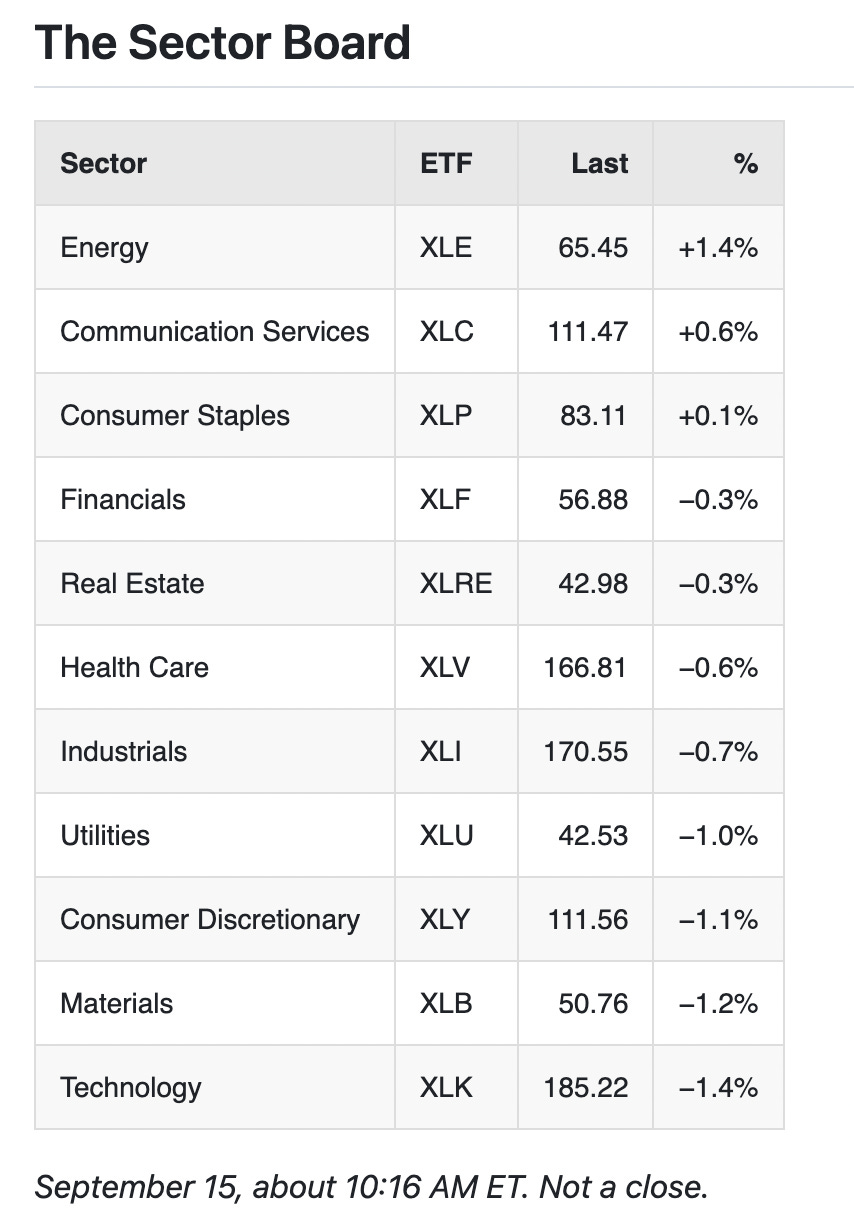
September 15, about 10:16 AM ET. Not a close.
Three of eleven green, eight red, and the whole board fits in 2.8 points. It happens to be symmetric: Energy is the best at +1.4% and Technology is the worst at −1.4%. Financials and Real Estate are tied at −0.3%, so we’re not ranking one above the other.
Energy up while crude is up is the one relationship on this page that behaves. Nothing surprising there, and it’s worth saying out loud when something does what it’s supposed to.
Technology at the bottom is the one that doesn’t square on first read, because the chip names are mostly green. That takes us to the next table.
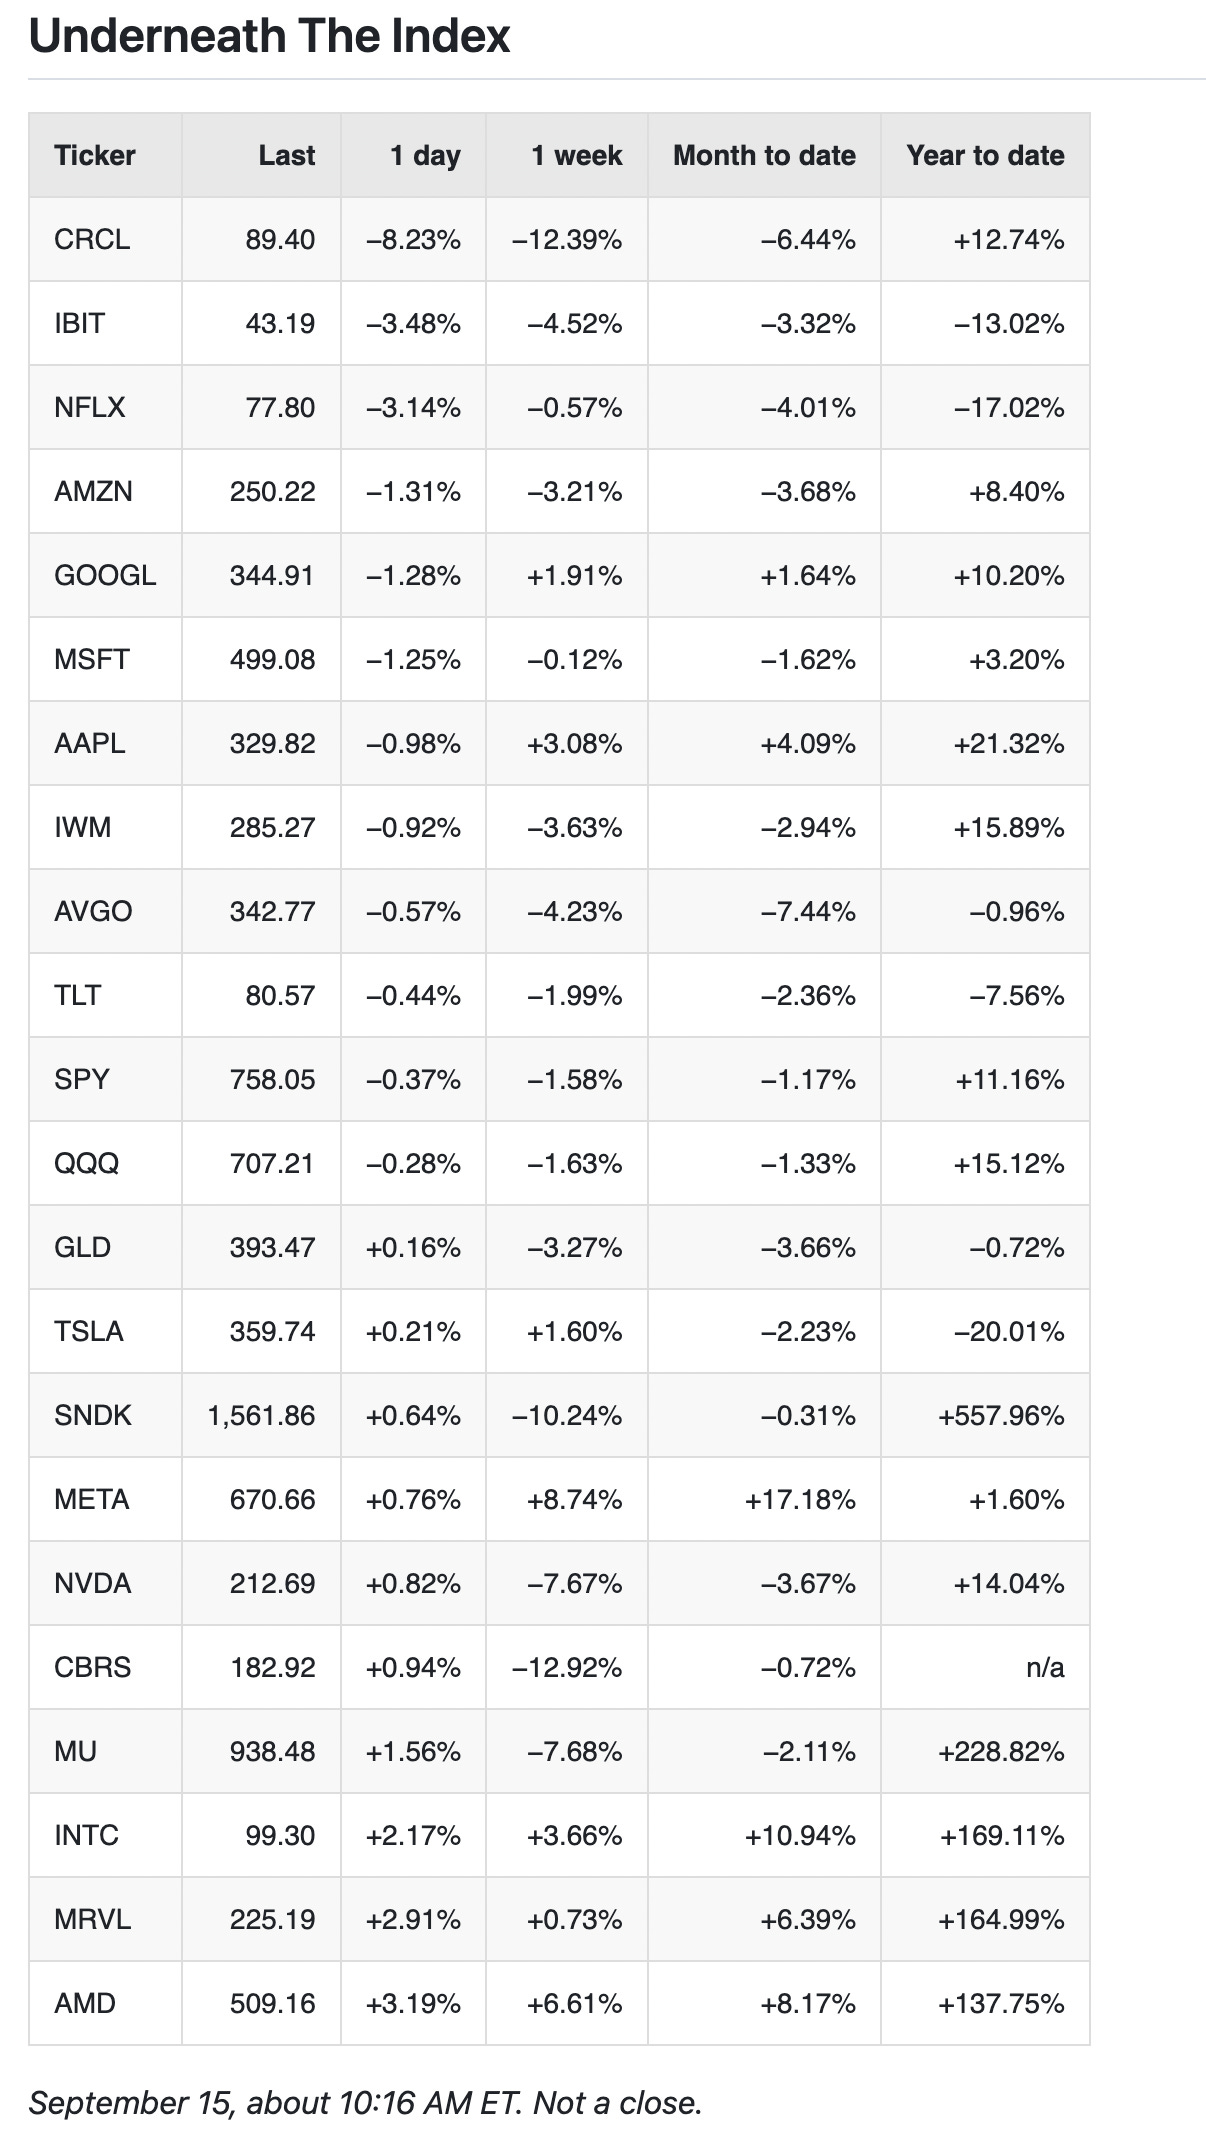
Ten of these twenty-two are higher. That’s our own watchlist, chosen for what we follow, not a market-wide count. We don’t have advance-decline data in front of us and we’re not going to imply we do.
The chips. Five of the six chip names are up: AMD +3.19%, Marvell +2.91%, Intel +2.17%, Micron +1.56%, NVIDIA +0.82%. Broadcom is the exception at −0.57%. Over the past week the same six split right down the middle: AMD +6.61%, Intel +3.66% and Marvell +0.73% higher, Micron −7.68%, NVIDIA −7.67% and Broadcom −4.23% lower. So this morning isn’t the group moving together, it’s three of them bouncing and three of them continuing.
The year-to-date column on those six is the thing that’ll make you blink. Micron +228.82%, Intel +169.11%, Marvell +164.99%, AMD +137.75%. NVIDIA is +14.04% and Broadcom is −0.96%. Four chip names up more than 130% on the year, and the one everybody argues about is up fourteen. That’s the trade of 2026 hiding in plain sight.
The big names. Five of the seven megacaps are red: Netflix −3.14%, Amazon −1.31%, Alphabet −1.28%, Microsoft −1.25%, Apple −0.98%. Meta +0.76% and Tesla +0.21% are the two that aren’t. Amazon, Alphabet and Microsoft are within six hundredths of a point of each other, which is the sort of thing that happens when a sector gets sold rather than a company.
Meta is the best name here over the past week at +8.74% and the best month to date at +17.18%, and it’s still only up 1.60% on the year. The newswire carried why this morning: in-house chips, ARKE deploying in the first half of 2027 and a next-generation ASTRID at the end of 2027, with the company saying they “will save money and energy compared with NVIDIA.” The wire also had the stock at a session high, up 2%, on that news. Our board caught it at +0.76% at 10:16, so those are two different moments and we’re not going to pretend otherwise. NVIDIA, meanwhile, was up 0.82% at that same moment.
The rest of it. CRCL is the worst thing here at −8.23%, more than twice the next worst. Bitcoin’s proxy and bitcoin itself agree, which is reassuring in a boring way: IBIT −3.48% against BTC at −3.5%. TLT is off 0.44% on the day and 7.56% on the year.
IWM is down 0.92% on the day and 3.63% on the week, and it’s still up 15.89% on the year, ahead of QQQ at +15.12% and SPY at +11.16%. Small caps are having a much better year than the headlines about them suggest.
Something on that row needs flagging. IWM is down 0.92% here while the Russell 2000 index in the scorecard above is down 0.6%. A fund and the index it tracks ought to be closer together than about three tenths of a point. The honest reason is a boring one: those two readings were captured minutes apart rather than in one synchronised print, and on a tape that keeps moving through the morning a few minutes is enough to open a gap like that. It isn’t a market signal. We’re printing both and not picking one.
Two more things, both of them gaps we’d rather state than paper over. CBRS has no year-to-date figure on our board this morning, so that cell reads n/a and it will stay n/a; we’re not filling in a number we don’t have. And six of these twenty-two carry a reading for distance below the 52-week high while the other sixteen don’t, so rather than print a column that would be blank for sixteen of the twenty-two rows: SPY is 2.74% below its high, QQQ 5.54%, NFLX 37.69%, IBIT 39.87%, CRCL 43.94% and CBRS 52.65%. The index funds are barely off the highs. The busted names are very busted.
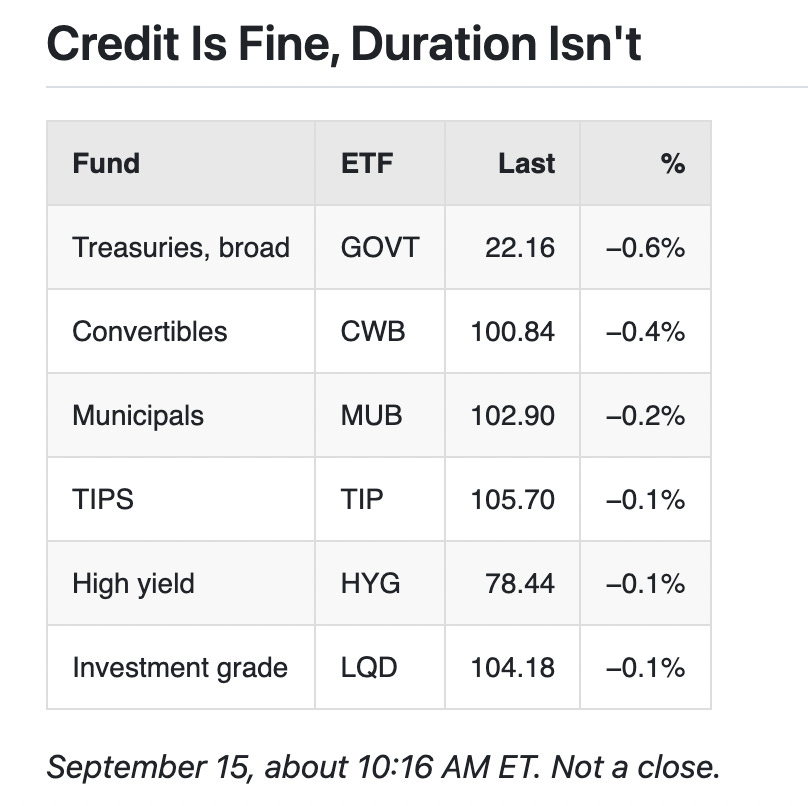
All six are lower, and the broad Treasury fund is the worst of them at −0.6%. Convertibles are down 0.4%, municipals 0.2%, and high yield, investment grade and TIPS are each down a tenth. Government paper taking the worst of it while corporate paper barely moves is the market telling you this is about the price of money, not about anybody’s ability to pay it back.
A pair on these tables doesn’t line up either, and the same caveat applies. GOVT is down 0.6% while TLT, which is much longer paper, is down 0.44% on the movers table above. On a day driven by the long end you’d expect the opposite. These readings were captured minutes apart too, and the long end can move a fair amount between one capture and the next. We’re not going to build a story on the gap, and we’re not going to hide it either.
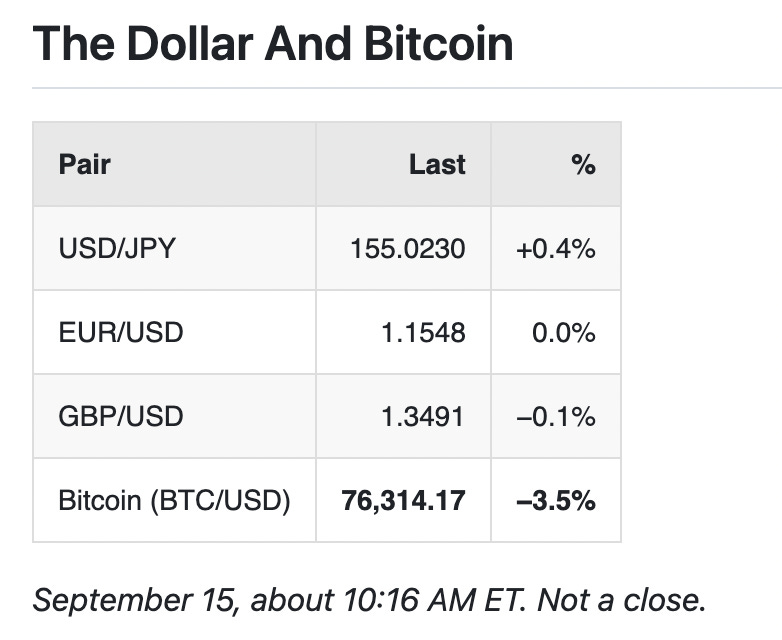
The dollar isn’t doing one thing. It’s up 0.4% on the yen at 155.0230, dead flat against the euro, and a tenth of a percent firmer against sterling. Calling that “dollar strength” would be over-reading three numbers.
Bitcoin is the real move, down 3.5% to 76,314.17. That’s a risk asset behaving like a risk asset on a morning when the cost of money went up, which is roughly the opposite of the story its loudest supporters tell. IBIT is off 3.48% and 13.02% on the year.
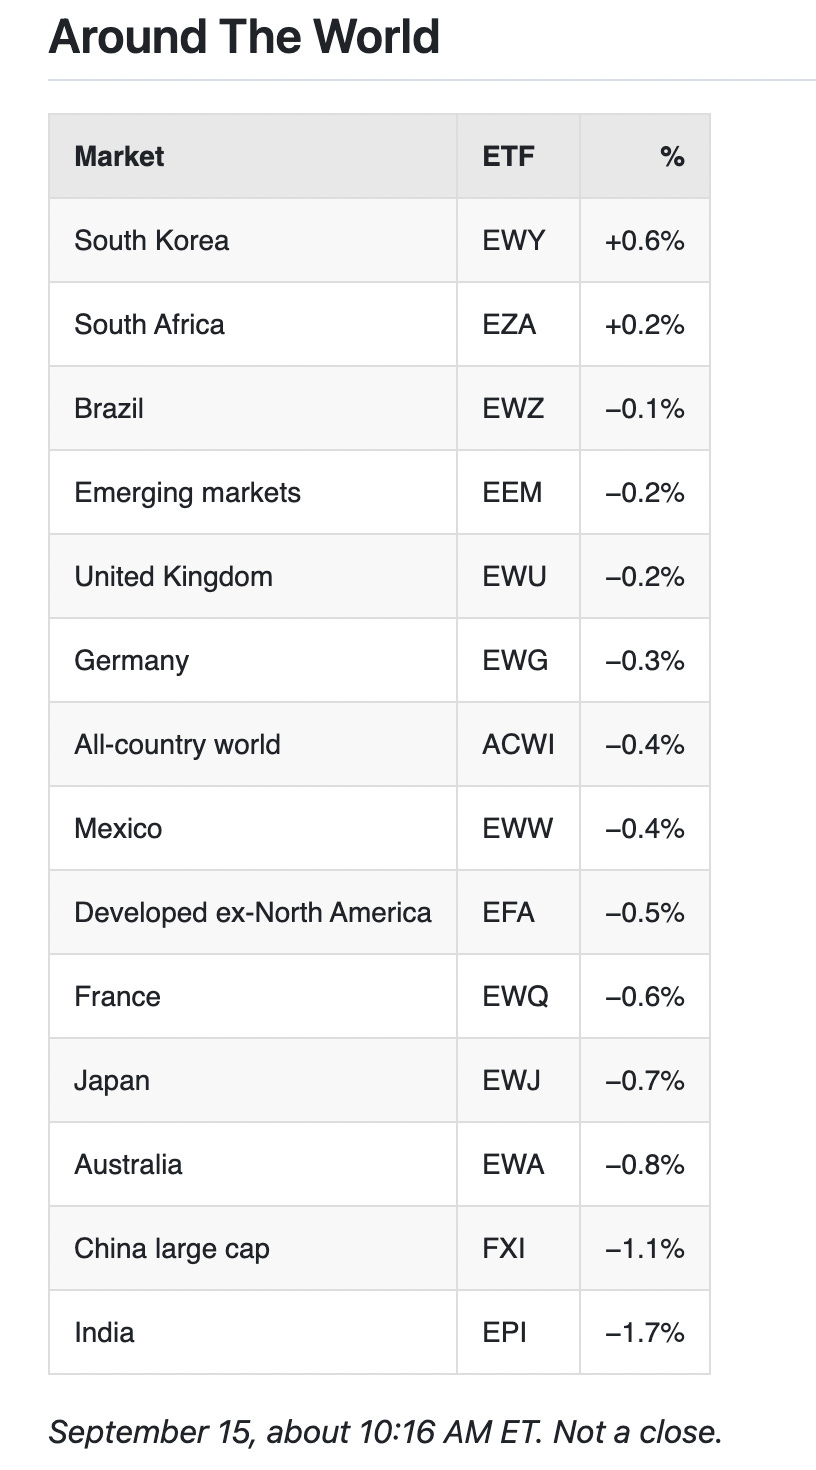
Twelve of the fourteen are red. India is the worst at −1.7%, China next at −1.1%. South Korea is the best at +0.6% and South Africa the only other green one at +0.2%.
South Korea green on a morning when five of our six chip names are green: we’ll call that consistent and leave it there. One session doesn’t prove a link and we’re not going to pretend it does.
Trusted Voices
One today, and it lands squarely on the bond move at the top of this letter.
Keith McCullough (@KeithMcCullough), posted today:
“CHART OF THE DAY: We Have Remained Short Of Bonds BEFORE The Breakdown $TLT”
That’s his position and his framing, not ours. What we can do is put it next to the numbers. TLT is −0.44% today, −1.99% over the past week and −7.56% year to date, with the ten-year at 5.011%. Whatever you think of the call, the tape has been going his way.
What’s worth sitting with is that he and the Treasury Secretary are looking at the same bond market today from opposite ends. Bessent’s answer is about cause: oil and global factors did this. McCullough’s post isn’t about cause at all, it’s about positioning, and the word he capitalised is BEFORE. We’re not adjudicating that and we don’t have to. We’d only note that if oil really is the explanation, today’s crude print and a 68% year-over-year diesel number say the pressure hasn’t come off.
Plenty of other posts came across today. Most were good reading without being a call on this market, so they aren’t in here. A thin Trusted Voices section beats a padded one.
Bottom Line
Written mid-morning, and we’ll say it one more time: none of this is a close, and by four o’clock the numbers will have moved.
The ten-year through 5% is the thing. It’s a small move over three sessions and a big number to look at, and it’s global, with Britain forty basis points above us and Japan’s long end steepening in a way ours isn’t. The US thirty-year pays you thirty-seven basis points over the ten-year, which is thin compensation for twenty years of risk.
The equity damage is modest and it’s uneven. Ten of twenty-two names on our board are green, three of eleven sectors are green, and SPY is under three percent from its 52-week high. This is not a market coming apart. It’s a market repricing money while the index sits still.
Energy and crude are doing what they’re supposed to, and the pump is where this shows up for people who don’t own a portfolio. Diesel up 68% year over year is a macro fact with a long fuse.
And gold did nothing again. On September 10 it actually fell 1.7% while crude ran 6.9%. Same failure, twice in four sessions. If you own the metal as insurance against exactly this set of headlines, ask yourself what would have to happen for the policy to pay, and whether you still believe the answer.
We don’t have an economic calendar in front of us today, so we’re not printing one and we’re not guessing at what’s next this week.
Disclaimer
This is not investment advice. Nothing in this letter is a recommendation to buy or sell any security. Grow Your Pile and Squared T Capital publish what we do in our own accounts for education. Options involve substantial risk and are not suitable for every investor. A short put can require you to buy stock at the strike price and can lose more than the premium collected. Past results do not predict future results. Do your own work and consider speaking with a licensed advisor about your circumstances.
Past performance is not indicative of future results, and results shown are those of our own accounts and are not representative of any subscriber’s results. Read the Characteristics and Risks of Standardized Options before trading.
Tony Rihan and Tony Battista Grow Your Pile
Every options trade in all three portfolios is published, win or lose, with entry, exit and running P&L at growyourpile.com.