Wednesday got written up as an equity story because the S&P fell 0.8% and the Russell fell 1.8%. It wasn’t one. What moved was the global bond market, and stocks were downstream of it.
The US five-year closed at 5.007% and the ten-year at 5.121%. Tuesday they were 4.849% and 4.970%. Both crossed five percent inside a single session, and they did it almost in parallel: 15.8 basis points at the front, 15.1 at the back.
The part worth sitting with is what came down with them. Treasuries fell 0.8%, high grade credit fell 1.1%, TLT fell 1.58%, and GLD fell 1.80%. When stocks, bonds and gold all go down on the same afternoon, that is not fear. Fear buys gold and it buys Treasuries. This was a repricing of the cost of money, and everything priced off the cost of money went down together.
Not advice — full disclaimer below.
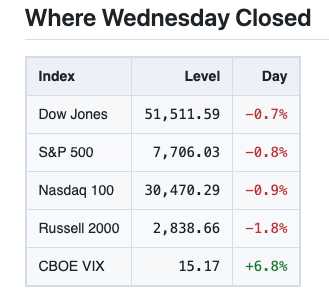
The VIX went from 14.20 on Tuesday to 15.17. A 6.8% jump sounds like something, and on a day when all fourteen global-market ETFs closed red it should have been. It's still a fifteen handle. Hold that thought until the bottom of the letter, because it decides what you're actually being paid to sell into this.
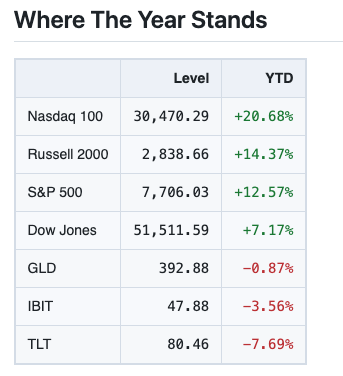
More than thirteen points between the Nasdaq 100 and the Dow, and the long bond down 7.69% on the year. That is the shape of 2026 in one table.
The breadth number underneath it is the one that keeps mattering. IWM is down 4.09% this month and closed 7.62% below its 52-week high. QQQ is up 3.41% this month and closed 0.99% off its own. The index is at the highs. The average stock is nowhere near them.
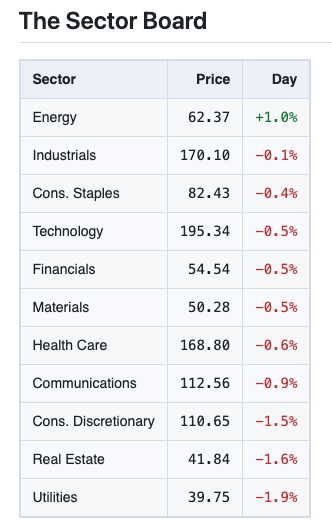
One sector was green and it was Energy, up 1.0%, before any of the overnight news. The two at the bottom are Utilities and Real Estate, the two sectors that trade most like bonds. That ordering is not a coincidence, it’s the same move as the yield table below.
The year’s leaderboard didn’t change. SNDK is up 665.26% in 2026, MU 275.56%, INTC 232.25%, AMD 186.99%. All four were red Wednesday and all four are still the year. The odd one in that group is NVDA, up 20.92% on the year against the Nasdaq 100’s 20.68%. The stock everybody thinks of as the trade has essentially matched the index it lives in.
What broke was Alphabet. Down 3.80%, the largest one-day loss of any name in this letter, and it closed 17.32% below its 52-week high while still up 7.93% on the year.
The money for the build-out is still there. BlackRock and IFM are in exclusive talks on a $25 billion data centre deal, per First Squawk overnight, and The Information has DeepSeek at $1 billion of annualised revenue with a $7.5 billion raise near completion. The capex keeps getting funded even on the days the stocks don’t work.
Every Government On The Board But One
Wednesday was not an American event. The US and Europe moved together, and that is the whole argument.
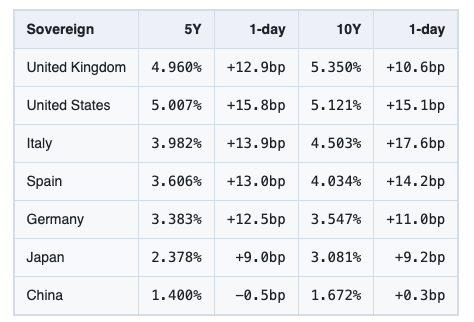
The United States, the UK, Germany, Italy and Spain all rose at both tenors on Wednesday. Japan rose at both tenors too, at its own most recent close. China alone did not move: the five-year down half a basis point, the ten-year up three tenths. Six governments out of seven going the same way is what tells you this wasn’t about one country’s budget.
Italy moved most at the long end. 17.6 basis points on the ten-year, more than the United States managed. The United States led at the front instead; nobody’s five-year rose more than ours.
Then look at the two American columns next to each other. Just over eleven basis points between our five-year and our ten-year. Germany has sixteen, the UK thirty-nine, Italy fifty-two, Japan seventy. Going out five extra years in Treasuries pays you a rounding error, which is the trouble with “just lock in 5%”: the whole US curve is at five, so you take the duration risk for nothing.
Nothing in fixed income was spared either.
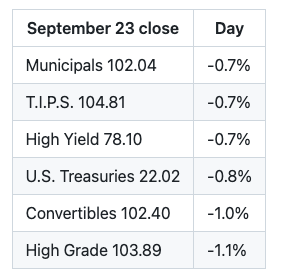
Read that order twice. High grade corporate paper lost more than high yield did. Credit didn’t blow out; high grade simply carries more duration and less coupon, so in a pure rate move it is the one that gets hurt. TIPS fell too, which means real yields rose, not only inflation expectations.
And the headline fact underneath all of it: Treasuries closed down 0.8% on a day the S&P closed down 0.8%. The bond side did not cushion a thing.
Crude Turned Around Overnight
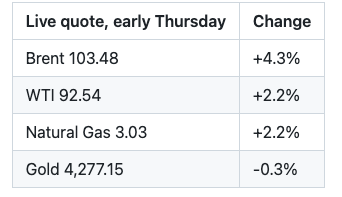
Yesterday morning we led on crude going the other way. We told you it was “barrels not talk”: Iran had reported half the damaged South Pars gas capacity back in production, barrels were physically returning, and we quoted WTI near $89.60 before Wednesday’s open. It’s $92.54 as this goes out.
We’re not walking that back, because nothing has undone it. Those Iranian barrels are still coming. What landed overnight is a second supply story sitting on top of the first, pointing the other way. Wednesday’s story was about how many barrels exist. This one is about whether they can move.
Russia said its forces struck a tanker in the Black Sea. That headline crossed a little after two o’clock this morning, New York time. Crude is higher overnight, Brent by 4.3%.
Brent over WTI is now $10.94, and Brent is rising close to twice as fast. That spread is the tell, and it is what separates transit from production: a threat to shipping lands on the waterborne benchmark first, and the landlocked one follows at half speed. Germany’s foreign minister spent the same hours calling for an immediate ceasefire starting in the Black Sea to protect grain shipments, and Poland launched preventive air operations again. The tanker is the trade; the rest is context for why it might not be a one-day move.
Energy was already the only green sector on Wednesday, before any of this.
One thing to keep straight, because these figures are not all from the same moment. Every index, sector, single-stock and ETF, sovereign yield and fixed-income figure above is a Wednesday, September 23 close. The crude, natural gas and gold prices are live quotes taken in the small hours of Thursday, September 24, and they will have moved by the time you read this. So GLD down 1.80% on Wednesday and gold quoted down 0.3% this morning are two different measurements, not a contradiction.
What Else Crossed
Spain’s August producer prices came in at 13.2% year over year against 9.2% the month before. The monthly print was 2.9%, and the month before that was 3.0%. Two consecutive months near three percent at the factory gate is the part to notice, not the annual number.
Benzinga ran a headline overnight reading “McDonald’s CEO Shares Grim Inflation Outlook” with the chief executive quoted as “Not Expecting Things to Change.” The same feed, around midnight New York time, had bitcoin slipping below $85,000. IBIT closed Wednesday down 1.95% and is down 3.56% on the year.
France published a set of confidence surveys that point two ways at once. Business confidence 96 against 98 the month before, manufacturing 101 against 103, both below estimates. But French firms’ own production outlook jumped to 15 from 9 with the estimate at 10, and the broader production outlook indicator improved to -9 from -11. Companies are gloomier about the economy and more cheerful about their own order books. That is a familiar pattern and it never resolves cleanly.
The Australian ASX 200 finished 0.7% lower overnight at 8,702.00. The Wall Street Journal reported eurozone bond yields opening higher this morning, so Europe is extending Wednesday’s move as this goes out. US stock futures were soft around two o’clock: S&P 500 futures -0.37%, Nasdaq futures -0.45%.
Trusted Voices
Robin Brooks (@robin_j_brooks), last night
“Global bond markets are blowing up. It feels to me like the crowd that tells us this isn’t about fiscal stress is the same crowd that was rearranging the deckchairs on the Titanic. You think it’s AI investment driving yields in France and Italy vertical?”
The Italian half of that question checks out. Italy’s ten-year rose 17.6 basis points, the biggest move on the table, ahead of the United States. Whether the cause is fiscal stress is his argument to make and not ours, but the move he’s pointing at is real and it’s in the table above.
Michael Green (@profplum99), quoting Brooks
“I am old, but not that old. Meanwhile, it’s fiscal stress, Robin? Explain Australia.”
That is a fair challenge and we’re not going to referee it. What we can add is that Australia was hit too: the Australia ETF fell 2.5% in New York on Wednesday, more than the UK, France, Germany or Japan, and the ASX 200 gave up another 0.7% in Sydney overnight.
amit (@amitisinvesting), overnight
“U.S. 10-year Treasury yields climbed above 5.1%, their highest level since 2007, after a much stronger-than-expected PMI report reinforced concerns that economic momentum remains robust despite higher”
The post cuts off there. The “highest since 2007” and the PMI attribution are his, not ours. Our number is flat: the ten-year closed at 5.121%.
Steve Miller (@askslim), overnight
“The S&P is sitting about 1% off its high. That is not what a 60/40 owner is living with. That portfolio is trailing because the bond side is not doing its job. Yields are back over 5%. When rates go up, bond prices go down. The same inflation and rate pressure hitting stocks is”
Also truncated, and the visible part carries the whole argument anyway. It’s the plain-English version of the fixed-income table above. Treasuries -0.8%, high grade -1.1%, TLT -1.58%, on the same day equities fell. The diversifier is currently a second source of the same risk.
Keith McCullough (@KeithMcCullough), overnight
“The Fam made money in a Long Only today and is very close to being at all-time highs. Winners weren’t what people were buying on sale earlier this week.”
Worth printing because it’s the other side. Somebody made money Wednesday, and his read on how is that it wasn’t in the names that had just been marked down. That is his position and his own account, not our recommendation.
What We Did
Five short puts sold Wednesday, every one of them an open, $1,963.00 collected across the two portfolios.
Portfolio 1 added two steps to the ladder for $1,591.00. A SPY December 18 740 put at $10.61, which is $1,061.00 on the one contract, 86 days out, break-even 729.39. And an /MES November 6 7700 put at $106.00, $530.00 on the $5 multiplier, 44 days out, break-even 7,594.00.
Portfolio 2 sold three for $372.00: QQQ September 29 725 at $180.00, QQQ September 25 736 at $100.00, and IWM September 25 284 at $92.00.
Now the part that matters more than the credit. Three contracts expire tomorrow: two of Wednesday’s, plus a SPY 767 put sold Tuesday. They carry $300.00 of premium between them, against $178,700 of stock that could be put to the account in a single day. IWM closed Wednesday at 281.92, through its 284 strike. QQQ closed at 741.21, above its 736.
Five puts sold into a 15.17 VIX on a day when ten of eleven sectors closed red. That is thin compensation, and IWM is already through its strike with a day to go.
The Bottom Line
The ten-year closed Wednesday at 5.121%, and two different things are pushing on it. One is growth: amit reads the move off a stronger-than-expected PMI report overnight. The other is cost: crude quoted around $92 this morning. A growth signal and a cost signal, and the bond market can’t tell them apart in real time. It prices both as inflation. Spain’s producer prices and a fast-food chief executive saying he doesn’t expect things to change are that same message arriving from two more directions.
Now go back to the VIX. 15.17, up 6.8%, on a day when not one of the fourteen global-market ETFs closed green and both US tenors crossed five percent. That is a market repricing the cost of money, not a market that is frightened. It also means the compensation for selling volatility into this is thin. Thin compensation is an argument for smaller size, not for doing nothing, and it is exactly the sort of tape where the premium you collect has to be earned by the strike you choose rather than by the level of the index.
Europe has already opened yields higher this morning. Wednesday may not have been the end of it.
Disclaimer
This is not investment advice. Nothing in this letter is a recommendation to buy or sell any security. Grow Your Pile and Squared T Capital publish what we do in our own accounts for education. Options involve substantial risk and are not suitable for every investor. A short put can require you to buy stock at the strike price and can lose more than the premium collected. Past results do not predict future results. Do your own work and consider speaking with a licensed advisor about your circumstances.
Index levels, year-to-date figures, sector moves, individual stock and ETF moves, sovereign yields and fixed-income figures in this letter are September 23, 2026 closing figures unless another date is given, and are gross of any subsequent revision. Crude, natural gas and gold prices are live quotes taken in the pre-market hours of September 24, 2026 and will have moved by the time you read this; they are not September 23 settlement prices. Option premiums, break-evens and days-to-expiration in the What We Did section are our own executed fills from September 23, 2026, other than the SPY put identified there as sold on September 22. Headlines and quoted comments are reproduced from wire and public feeds; we quote them as published and do not paraphrase them into views their authors did not express. Two of the quoted posts were truncated by X and are reproduced only as far as the visible text goes. The description of the ten-year yield as the highest since 2007 and the attribution of the move to a PMI report are amit’s, and the description of Treasury yields as nineteen-year highs is Benzinga’s; neither is our own work. Commentary attributed to Robin Brooks, Michael Green, Steve Miller and Keith McCullough is their own and is not our recommendation.
Past performance is not indicative of future results, and results shown are those of our own accounts and are not representative of any subscriber’s results. Read the Characteristics and Risks of Standardized Options before trading.
Tony Rihan and Tony Battista Grow Your Pile · Squared T Capital
Every options trade in all three portfolios is published, win or lose, with entry, exit and running P&L at growyourpile.com.