


NVDA, Saturday September 12, 2026
Grow Your Pile is educational and is not investment advice or a recommendation to buy or sell any security. Stocks and options involve risk and are not suitable for every investor.
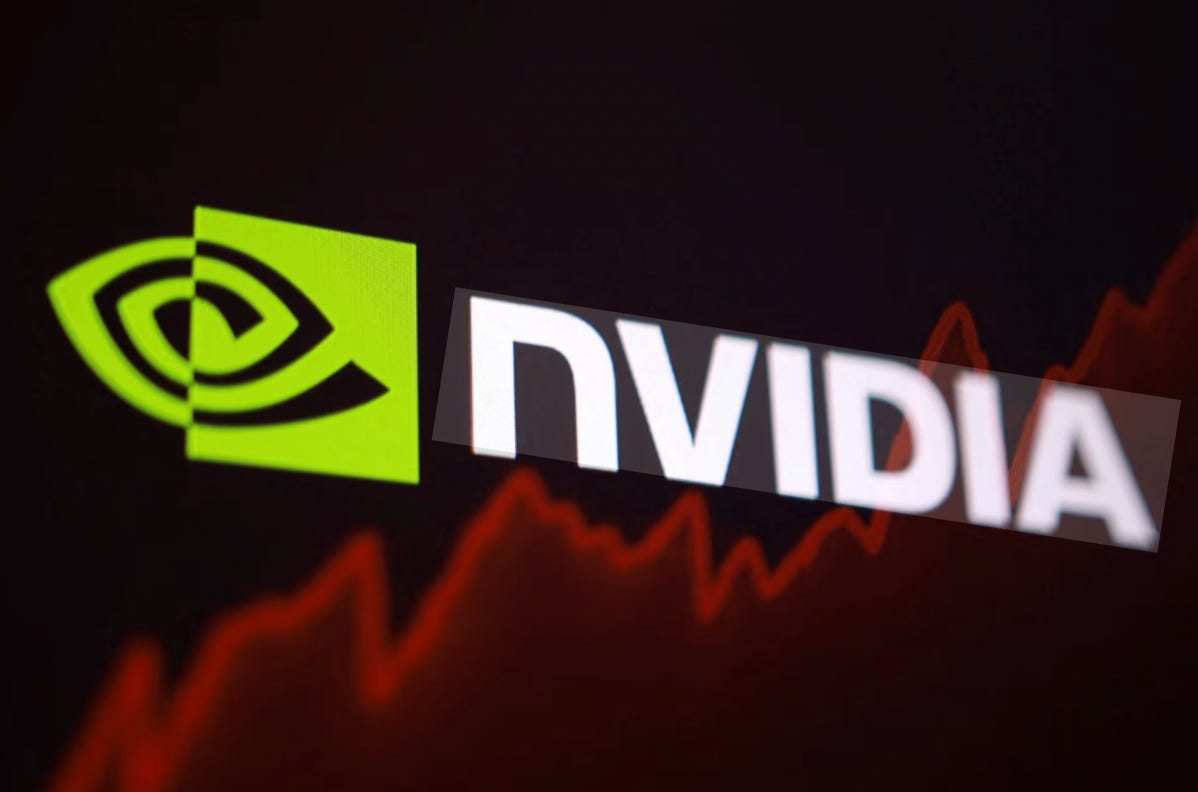
NVDA levels as of the Friday September 11, 2026 close: last 218.29, down 0.07, down 0.03% on the day. Open 221.24 · high 222.00 · low 218.15. Bollinger Bands (20, 2) at 208.05 / 219.94 / 231.83 · 200-day SMA 197.11 · RSI (14) sitting on fifty · 1-day Rate of Change −0.03%. 52-week range 164.27 to 236.54.
NVIDIA closed Friday down seven cents. It also closed fourteen cents off the low of the day, after opening at 221.24 and printing 222.00. Those two sentences describe the same session, and if you only read the first one you learned nothing about what happened in it.
That gap between the headline and the tape is the whole reason we’re writing this up. There’s an indicator page going around with NVDA marked Strong Sell on the technicals and Strong Sell on the moving averages, twenty-three readings and one of them green. Pull up the daily chart and you get a completely different animal: price in the middle of its Bollinger band, RSI on fifty, and a 200-day average at 197.11 that has risen all year with price above it since the spring.
Neither reading is wrong. They’re computed on different clocks, and the summary box doesn’t tell you which one you’re holding. That’s the first half of this letter, and NVDA on Friday is about as clean an example of it as we’re going to get. The second half is the company underneath the ticker, because the fundamentals on this one are doing something a lot more surprising than the chart is.
What’s in the rest of it. Two sources you’d both call respectable disagree about whether this uptrend is intact, and we settle it with arithmetic you can repeat yourself off numbers the disagreeing page prints. Then the company underneath the ticker, where the valuation has come down hard while the stock went up.
Where it closed — Friday’s four prices, the levels that frame them, and what the close is really saying about the session.
What the daily chart is actually saying — the 200-day’s own path across this year, and the one rule we follow about reading numbers off a chart image.
Strong Sell, and the clock it was measured on — how to work out which clock an indicator page is running on, using figures the page publishes itself. The moving averages give it away and the pivot levels confirm it.
What the multiple is actually saying — NVDA against its own five-year valuation history and against the index, and why the direction of the price move changes what a cheap multiple means.
What that multiple is buying — the profitability and the balance sheet, including whether that return on equity is earned or borrowed.
The margins, the cash, and the parts that are slowing — five fiscal years of margins in full, the one soft spot we’re not leaving out, and the question Tony put on the members dashboard on Friday.
The two scenarios — what has to happen either way, with the level for each. No targets and no predictions.
How a GYP member would express this — how the framework reads it, the cycle, and what a short put actually ties up. Analysis, not an alert: no trade card, no position claimed.
Trader Take and Investor Take — the short version of each, for whichever one you are.
Paid subscribers — the full breakdown below:
