

Technical Analysis: The Nasdaq 100 (QQQ)
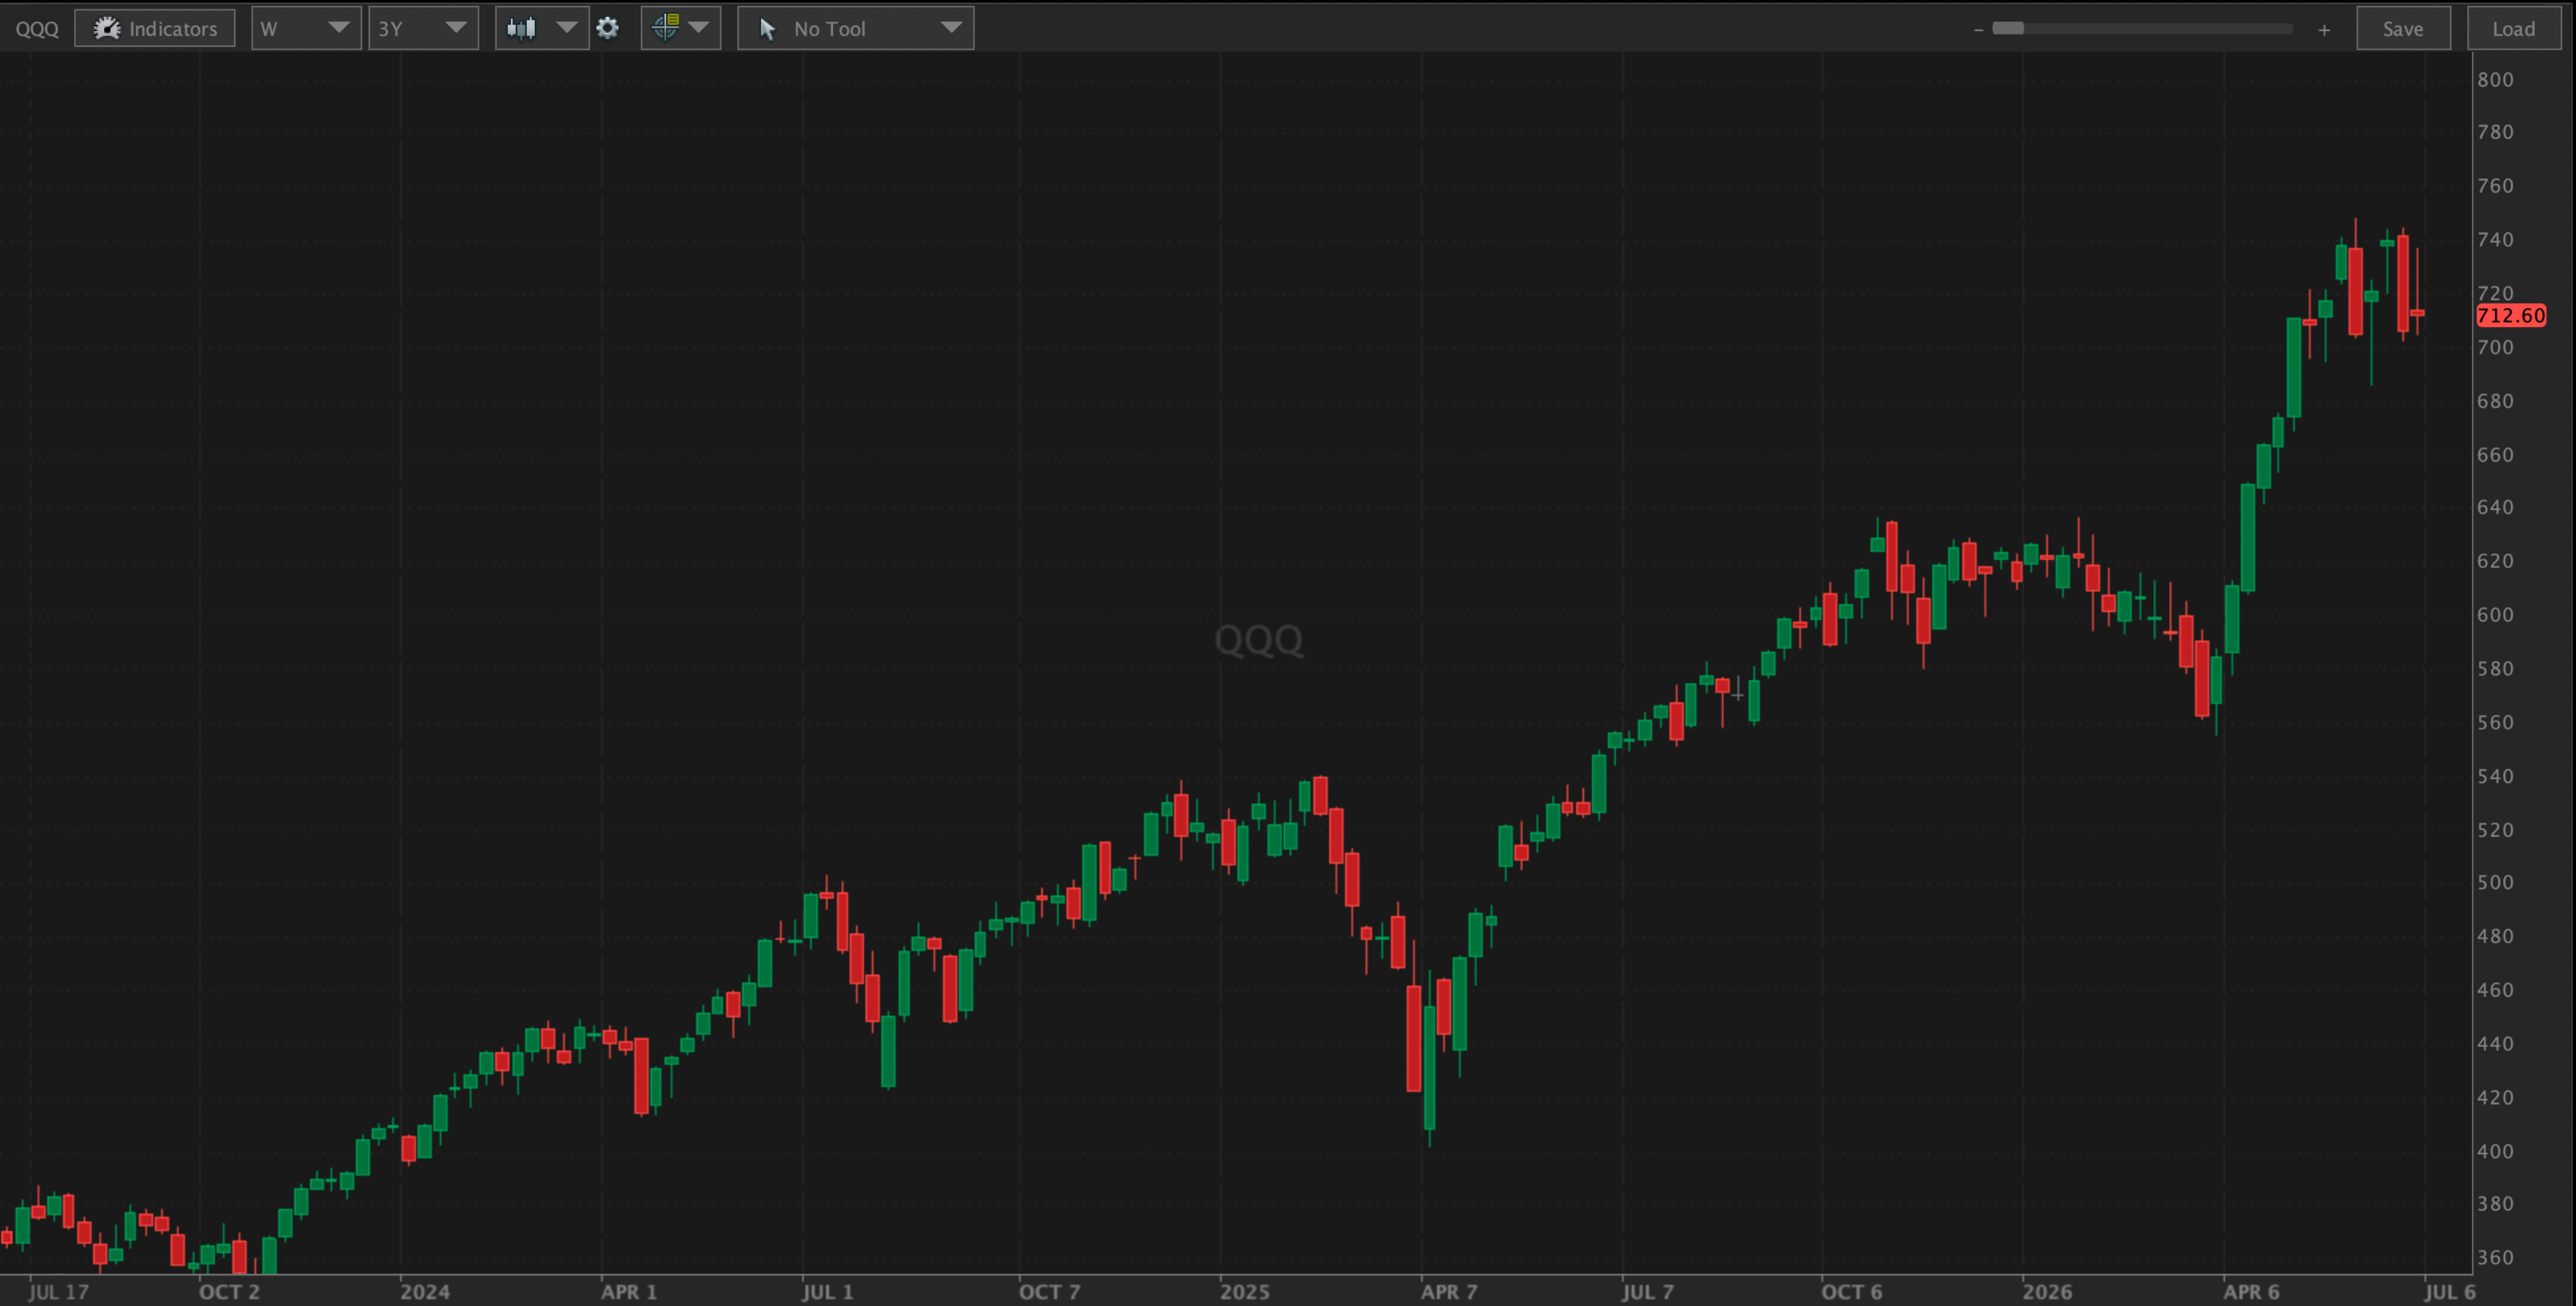
Weekly Chart · As of July 2, 2026 · Price: 712.60

The semiconductor-led wobble this week put the Nasdaq back in focus, so let’s step back to the weekly chart — the timeframe that filters out the noise and shows what’s really happening. Here’s the full technical read, plus the exact levels we’re watching and how we’re trading around them.
The Big Picture: The Uptrend Is Firmly Intact
Zoom out and the story is clean. Since the October 2023 low near ~355, QQQ has carved a textbook uptrend — a steady staircase of higher highs and higher lows. What stands out most is the character of the two big scares along the way:
Summer 2024: a sharp ~15% flush from ~500 to ~425 — bought aggressively.
April 2025: a violent ~24% drop to a spike low near ~405 — and an almost-vertical V-shaped recovery.
The lesson embedded in this chart: every major pullback in QQQ over the last two-plus years has been a buying opportunity, not a top. Until that changes, the burden of proof is on the bears.
The Current Setup: A Healthy Pause After a Powerful Run
The most recent leg is the important one. From the March 2026 low near ~560, QQQ launched a ferocious rally of roughly +33% in about ten weeks, printing an all-time high near ~748 before this week’s pullback to 712.60.
That’s a steep advance — the kind that gets extended and eventually needs to digest. This week’s red candle and the pullback off 748 are the first real pause since March. This is not a breakdown; it’s a rest. After a move that size, sideways-to-lower action that works off the froth is exactly what a durable trend wants.
Momentum & Structure
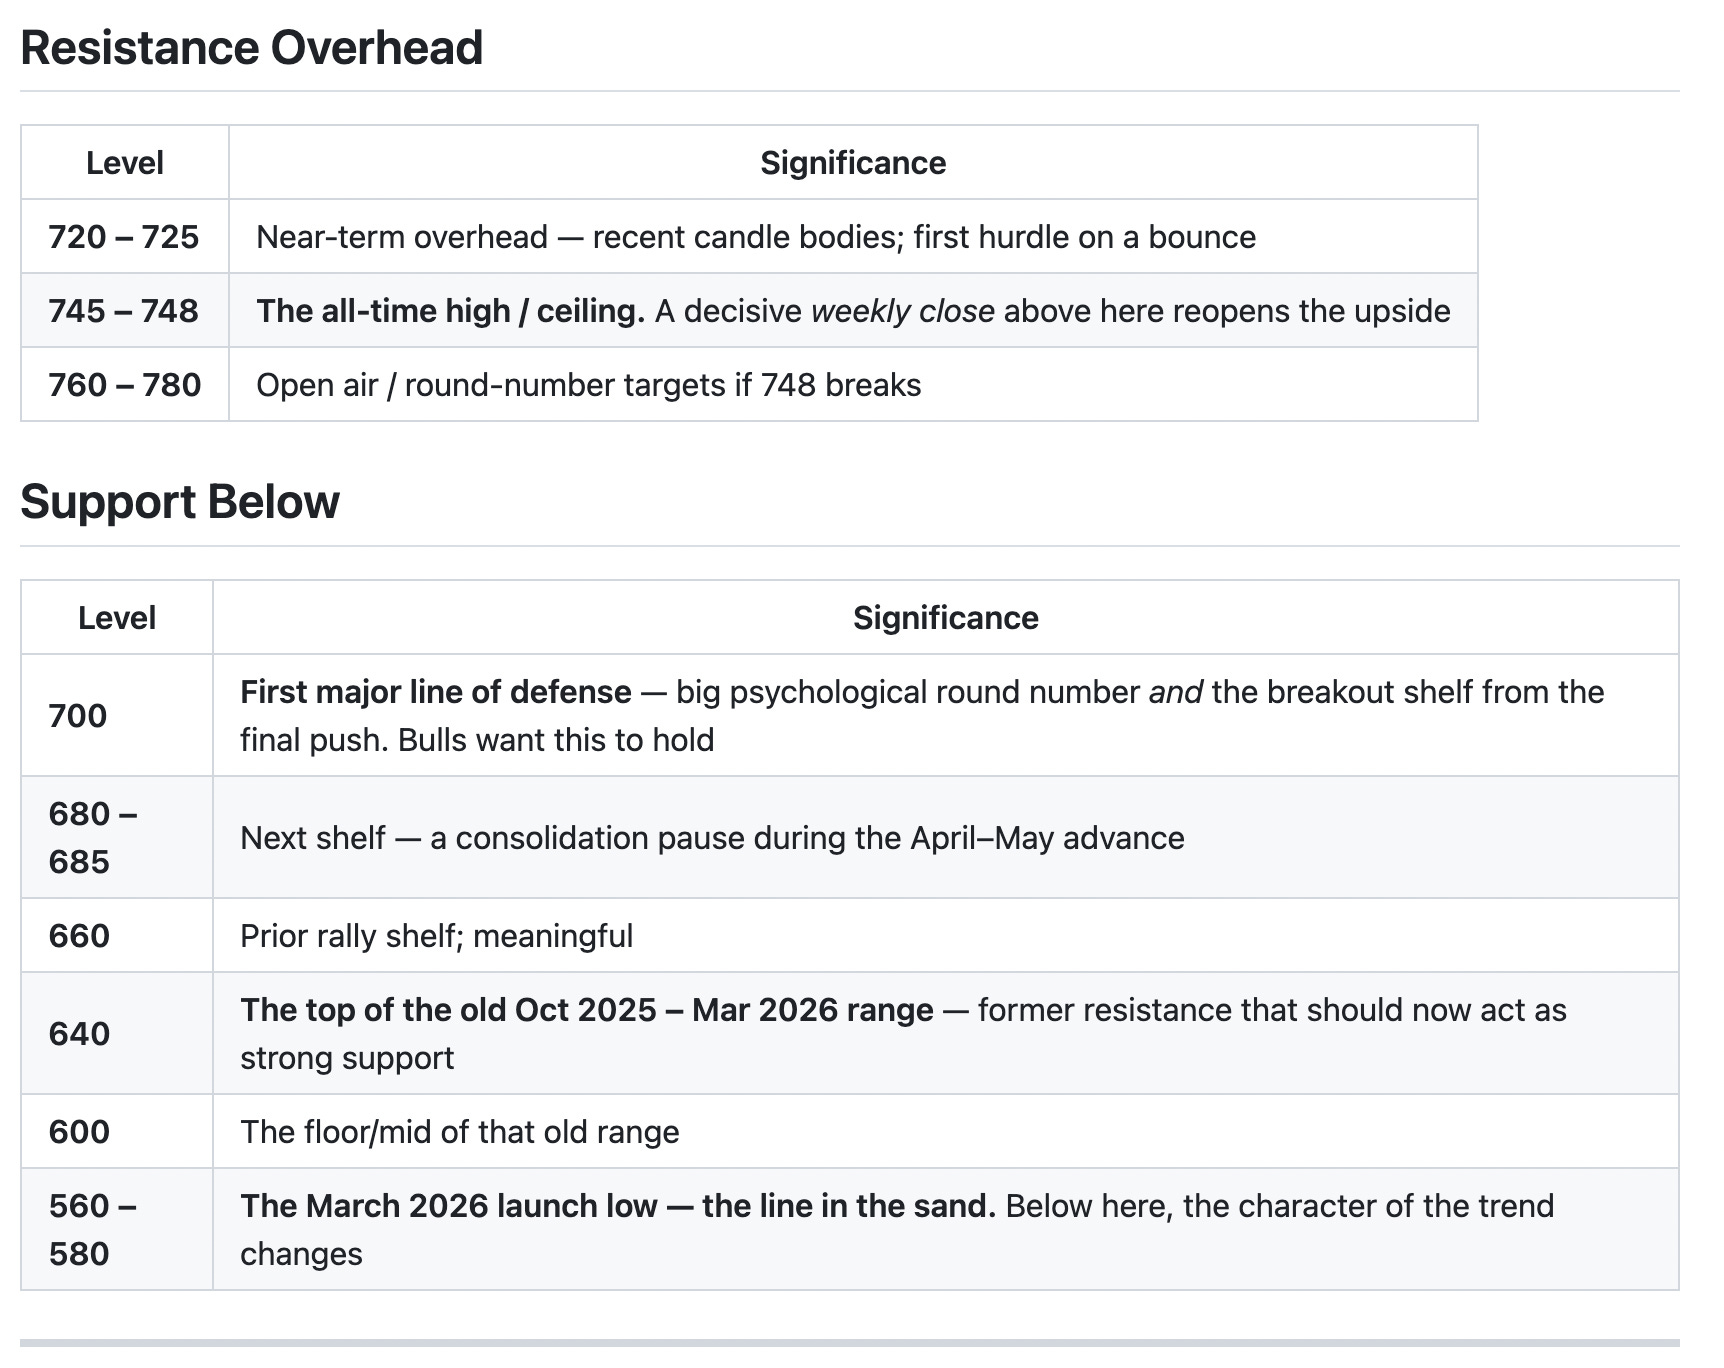
There are no oscillators on this weekly chart, but the price action tells the story: after a near-parabolic 10-week run, momentum is cooling in an orderly way. A weekly RSI that was almost certainly stretched into overbought at the 748 high is now unwinding toward neutral — healthy, not ominous. The pullback so far is controlled and shallow relative to the size of the advance. Watch for QQQ to either carve a higher low above 700 or dip to the 660–685 shelf to reset before the next attempt at the highs.
Three Scenarios Into the Second Half
Bullish (continuation): QQQ holds ~700, bases for a few weeks, and reclaims 748 on a weekly close → path opens to 760–780. The uptrend simply resumes after a pause.
Base case (most likely): a healthy digestion between ~680 and ~745 — chopping sideways, building a higher low, and working off the overbought run before the next leg. Constructive.
Bearish (deeper reset): a loss of 700, then 680, opens a retest of the 640–660 shelf (the old range top). Note: even that is still a constructive reset within the larger uptrend. Only a break of ~560 would genuinely damage the structure.
The most probable outcome is the boring one — a pause and digestion, not a crash.
How We’re Trading It at GYP
This is where technicals become actionable. In a pullback within an uptrend, our edge isn’t guessing the exact bottom — it’s getting paid to be patient at levels we’d want to own anyway.
The tech selloff popped Nasdaq volatility (QQQ’s implied-vol rank ran far richer than the S&P’s this week). Richer premium is a gift to disciplined sellers — we sell into the fear, not the calm.
Rather than chase the highs, we sell put premium down at the strong support shelves (the 700 / 680 / 640 zones), which either expire for income or hand us the Nasdaq at a discount at prices the chart says are well-supported.
We keep it defined or cushioned — with a hawkish-hold Fed and the July 24 tariff cliff ahead, this is a market that rewards structure over swinging for the fences.
For traders: let it come to you. The strong support shelves are your high-probability zones — sell rich premium there, keep risk defined, and don’t fight a healthy pullback by chasing.
For investors: the trend is your friend and pullbacks have been gifts. Nibbling into weakness toward the 660–700 support band — while keeping some dry powder for a deeper 640 test — has been the winning approach in this name for two years running.
Bottom Line
QQQ’s long-term uptrend is intact, and this week’s dip to 712.60 looks like a healthy pause after a powerful +33% run, not the start of something worse. 700 is the level that matters most on the downside; 748 is the ceiling to beat on the upside. As long as 560 holds, every pullback remains a setup, not a warning.
See exactly how we’re positioning the Nasdaq exposure across our portfolios — every trade is on the members dashboard.
Trade the levels, sell into the fear, and keep growing the pile.
— Tony Battista & Tony Rihan
Grow Your Pile · Technical analysis for educational and informational purposes only; not investment advice. Chart levels are read from the weekly QQQ chart and are approximate. Options involve risk and are not suitable for every investor. Past performance does not guarantee future results.