


Where it is
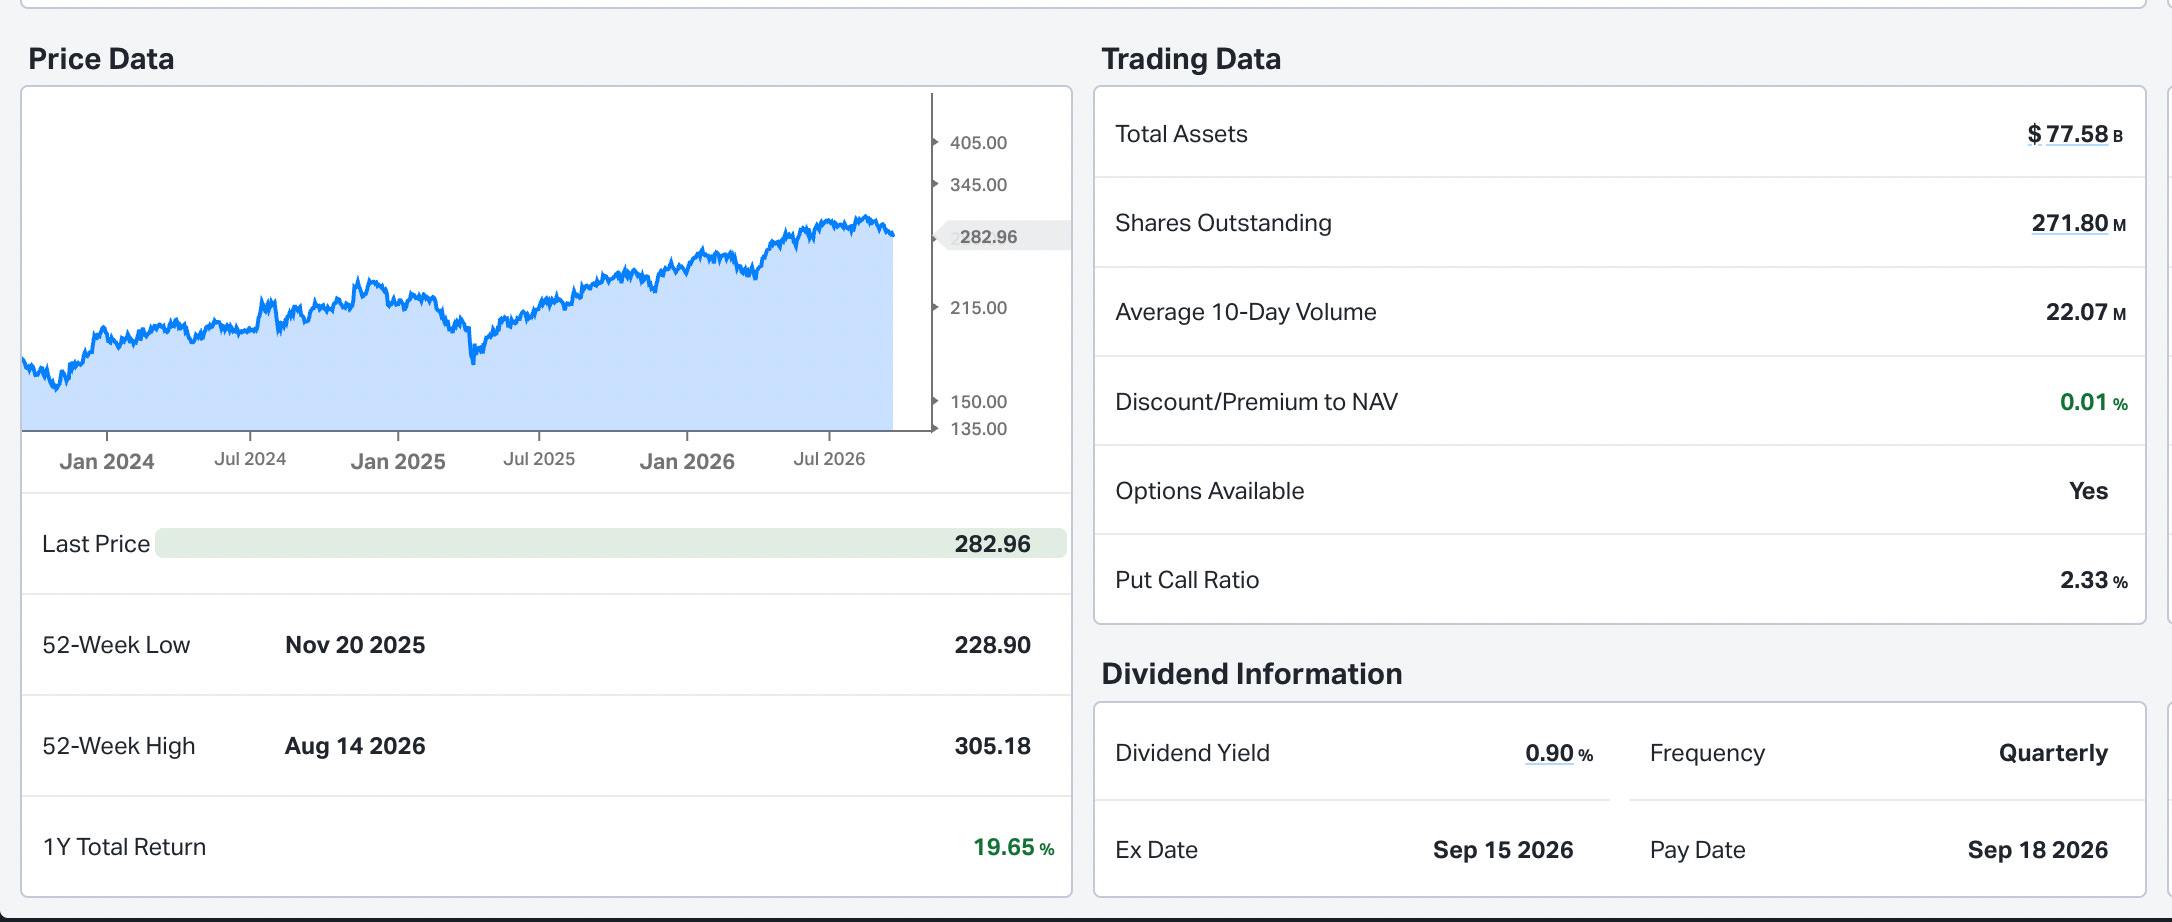
IWM is 282.96, down 2.47 on the day, off 0.87%. Thursday it closed at 285.43 after trading as high as 287.19 intraday, so this is a second leg lower rather than a one-day wobble.
The 52-week low is 228.90, set on November 20 last year. The high is 305.18, set on August 14. Price is 7.28% under that high and 23.62% above that low, about seven tenths of the way up its own range.
What the chart is actually saying
Three things, and they don’t all point the same way.
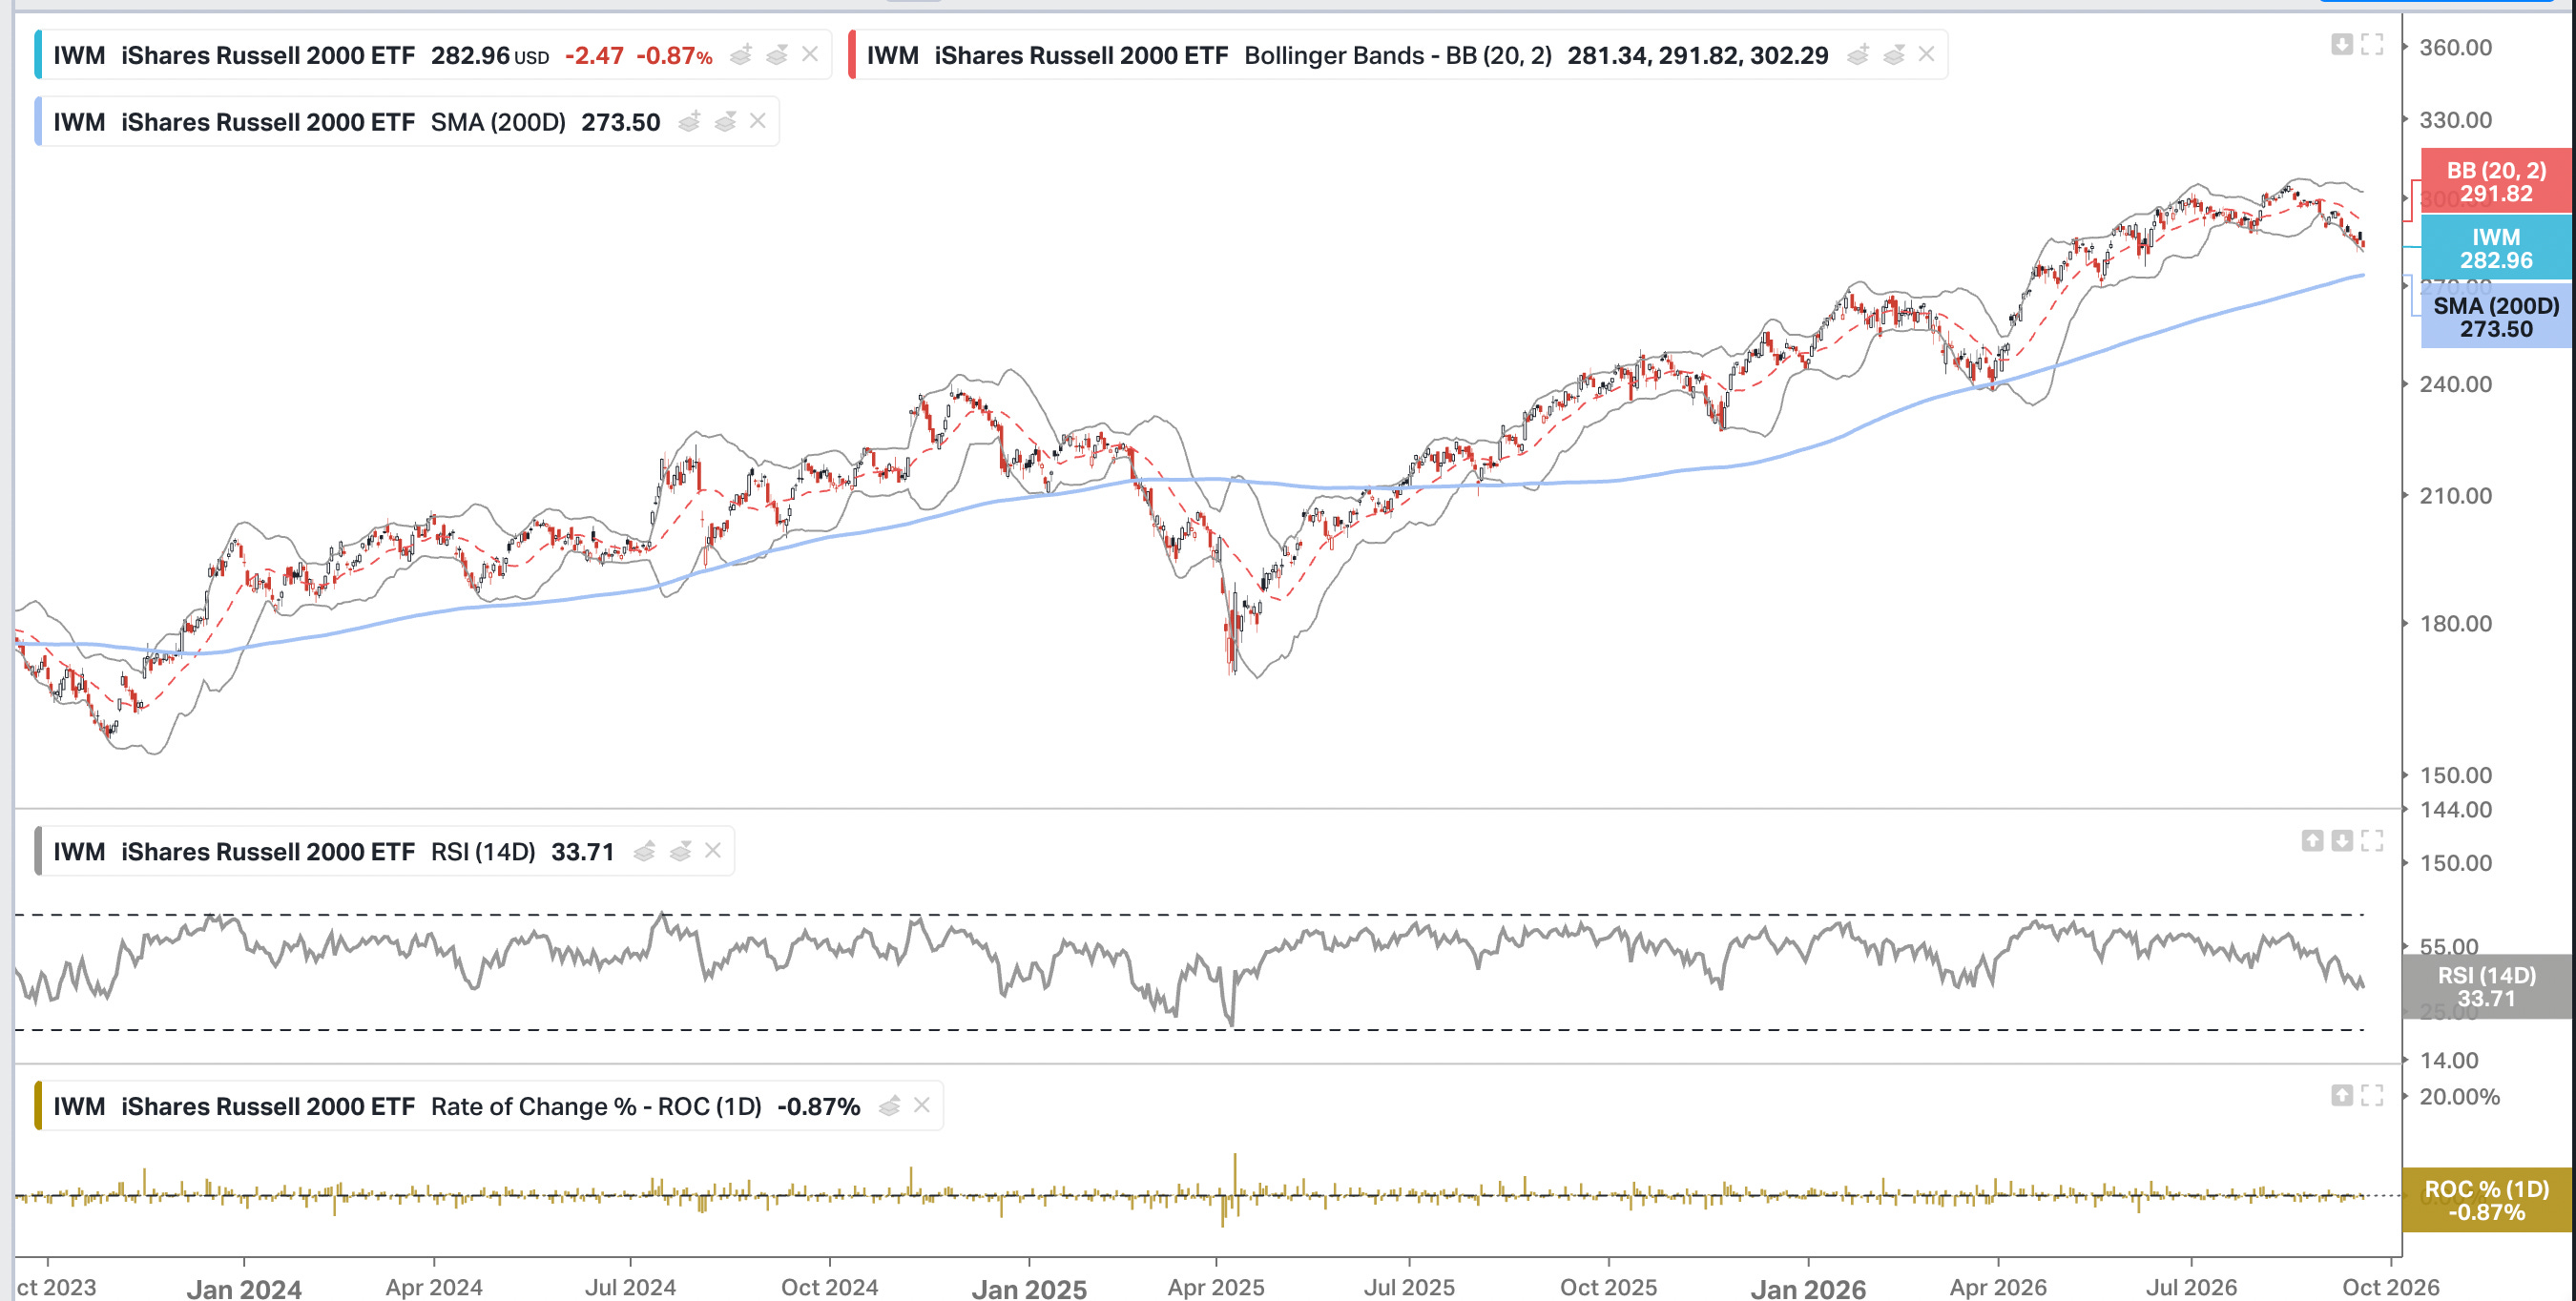
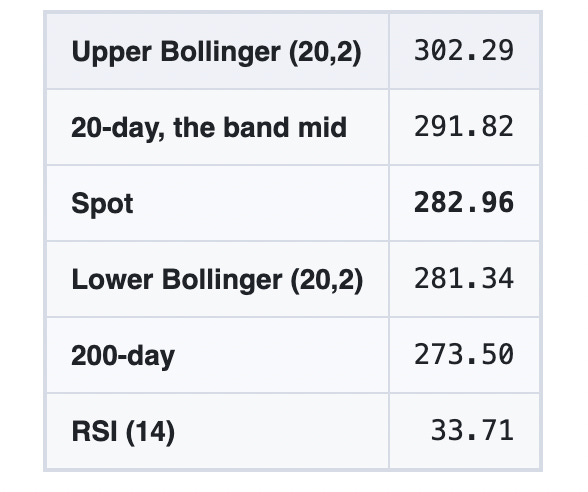
Price has lost the 20-day and is leaning on the lower band. 282.96 against a band mid of 291.82 is 8.86 points of daylight, and there’s only 1.62 between here and 281.34. Over the last month the whole structure has rolled from riding the upper band to testing the lower one. That is a change in character, not a pause.
RSI is 33.71. That’s weak. It is not, however, oversold in the way people mean when they say oversold. It hasn’t been through 30. The April 2025 washout on this chart took RSI down near 25 and price ten percent below the 200-day. Nothing like that is happening here.
And the 200-day is still rising, a long way below. 273.50, with price 9.46 points above it, 3.34%. Through every one of the last two years’ corrections, and there were several on this chart, the 200-day held and the uptrend resumed. The line hasn’t been touched yet, let alone broken.
So: a real pullback inside an uptrend that is still intact. Not a top, not a bottom. Somewhere uncomfortable in between.
The line that matters
281.34.
The lower Bollinger band is where this stops being a pullback and starts being a question. Price closed inside it Thursday and is pressing it now. Bands are not support. They’re a statistical envelope, and price can walk down the outside of one for weeks. But when a fund that has spent a year riding the upper half of its bands comes and sits on the lower one, the burden of proof has changed hands.
Below that, the next real level is the 200-day at 273.50. That is 3.34% from here. It is also the line that has caught every dip on this chart since the spring of last year.
The honest part: what we own, and what it needs
We sold one IWM September 24 280 put this morning for $1.00. That is one contract against an allotment of three, so a third of full size, and it expires in six days.
Credit 1.00 × 100 × 1 = $100.00. Break-even 280.00 − 1.00 = 279.00.
Now look at where that break-even lands on the table above. It sits at 279.00 — below the lower Bollinger band at 281.34, and above the 200-day at 273.50. In the pocket between the two.
That is not an accident and it isn’t clever either. It’s the whole reason for the strike. For this to lose money, IWM has to break the lower band, keep going, and close under 279 inside six days, which is a 1.40% move from here. For it to lose money in a way that actually hurts, it has to run at the 200-day, another 2 points below that.
What it needs is simple: 279 to hold for six days. What would make me uncomfortable is a close below the lower band on rising volume, because that turns a statistical edge into a trend.
And the position is small on purpose. A third of size, six days, in an asset class that has given back a third of its year in the last three weeks. That sizing is the argument, not the strike.
Underneath the fund
Two things about IWM itself are worth knowing if you’re going to trade it.
It is not concentrated, at all. 1,963 holdings. The ten largest are 3.35% of the fund combined, and the single biggest line isn’t a company — it’s BlackRock’s own treasury cash fund at 0.48%. The largest actual stock, Moog, is 0.34%. Under that: a software firm, a regional bank, a healthcare services business, medtech, two biotechs, an oil and gas name, and a bitcoin miner. The average position in this thing is five hundredths of one percent.
That’s what people are buying when they buy the Russell. Not a view. Breadth.
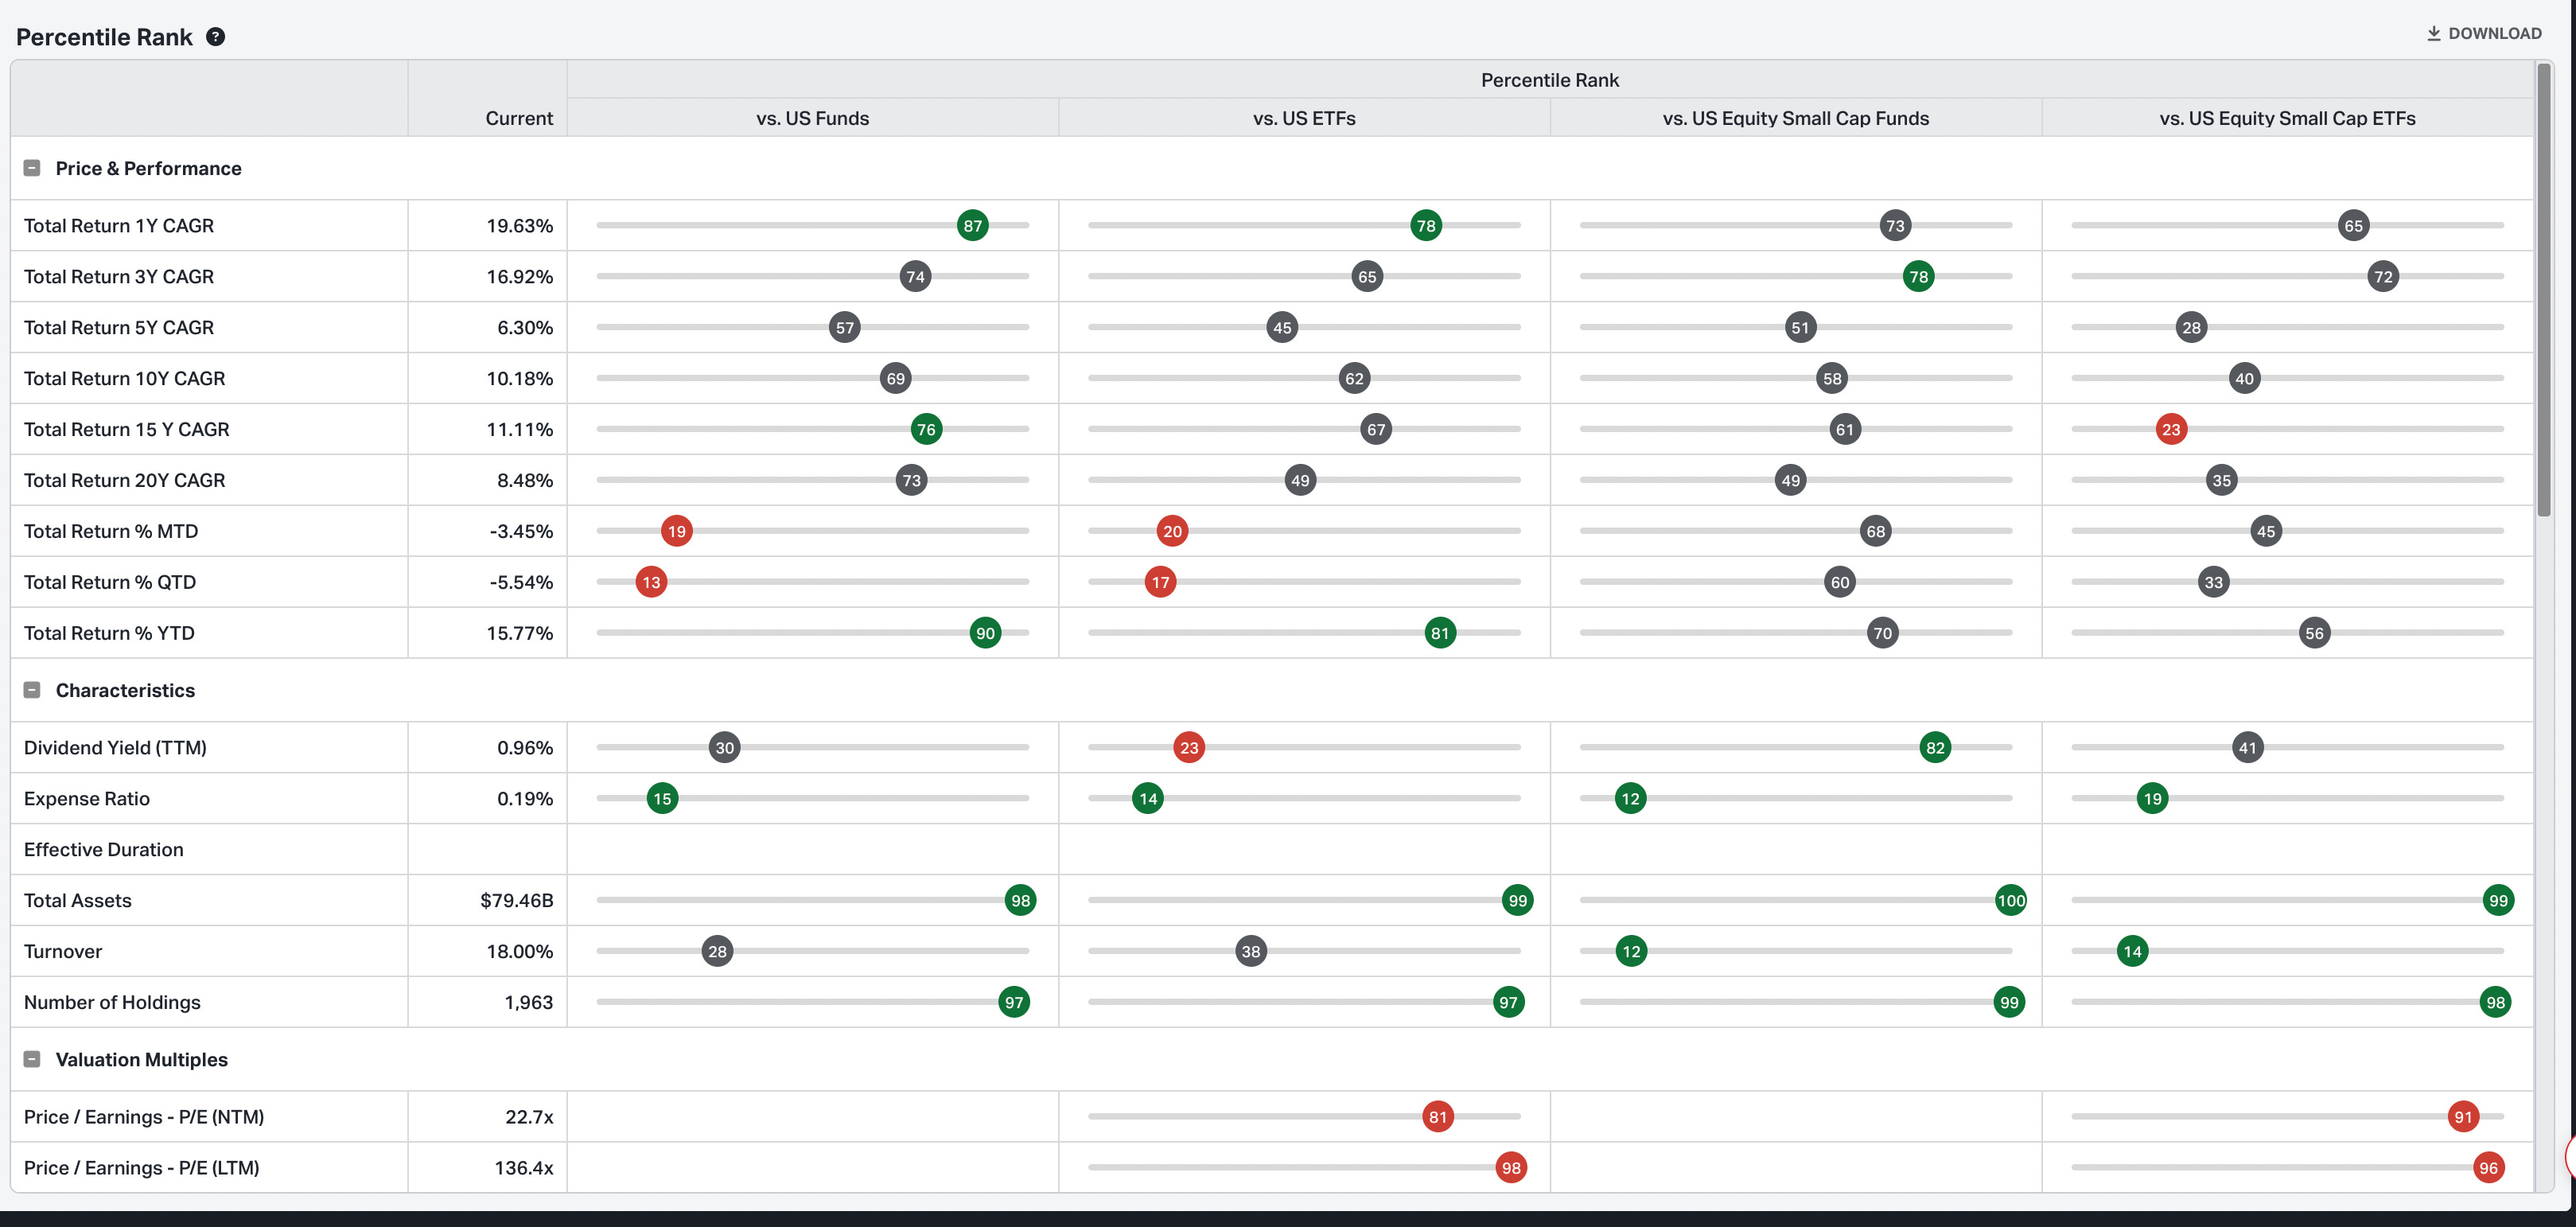
And the valuation depends entirely on which earnings you use. Trailing P/E is 136.4x. Forward P/E is 22.7x. Six times the difference. That gap is the entire small-cap argument in two numbers. Trailing earnings are depressed and a meaningful share of the index doesn’t earn anything at all, while the forward figure prices in a recovery that hasn’t shown up yet. Whether you think IWM is expensive depends on which of those two numbers you believe, and reasonable people land in different places.
Expense ratio is 0.19%. Around $78 billion in assets. Twenty-two million shares a day. Trading within a hundredth of a percent of NAV. As an instrument it is about as clean as they come.
Trader Take
The tape is heavy and the position respects that. Price under the 20-day, pressing the lower band, RSI in the low thirties. This is not where you sell full size and it isn’t where you get brave.
A third of allotment, six days, break-even below the band and above the 200-day. If IWM holds 279 through Thursday the put expires and we keep the hundred dollars. If it breaks the band and runs at the 200-day, the break-even was placed in the only pocket that gives room to manage rather than react.
The trade that would change my mind is a close below 281.34 with the 200-day still 3% away and no bounce attempt. That’s a trend, and short puts into a trend are how small positions become large problems.
Investor Take
Small caps have handed back a third of a good year in about three weeks. Down 3.45% this month, down 5.54% this quarter, still up 15.77% on the year. Against every US fund that quarterly number sits in the 13th percentile. Against its own small-cap peers it’s middling, around the 60th. So the weakness is the asset class, not this fund.
The 200-day is still rising and still untouched. Every correction on this chart for two years has stopped at or above it.
If you own IWM as a long-term holding, nothing here is a sell signal. If you’re waiting to start one, the levels are clear: 281.34 first, 273.50 second, and the second of those is where the last two years say the buyers show up.
What nobody can tell you is whether the forward earnings recovery that makes 22.7x reasonable is going to arrive. That is the question underneath the whole asset class, and it isn’t a chart question.
Disclaimer
This is not investment advice. Nothing in this letter is a recommendation to buy or sell any security. Grow Your Pile and Squared T Capital publish what we do in our own accounts for education. Options involve substantial risk and are not suitable for every investor. A short put can require you to buy stock at the strike price and can lose more than the premium collected. Past results do not predict future results. Do your own work and consider speaking with a licensed advisor about your circumstances.
Levels quoted above are read from a daily chart during Friday’s session and are not closing prices. IWM is an exchange-traded fund holding 1,963 underlying positions; the top-ten weights quoted are a point-in-time reading on September 18, 2026 and will drift. The short IWM September 24 280 put described above is an uncovered short put in Portfolio 2, and Portfolio 2 holds no IWM shares against it. IWM options are American-style and physically settled, so assignment can occur at any time before expiration rather than only at expiration, and would deliver shares rather than cash. Assignment would mean buying 100 shares of IWM at 280, or $280 × 100 × 1 = $28,000 of stock, which is what a cash account would need on hand against it, regardless of where the fund is trading at the time. Margin requirements vary by strike, expiry, volatility, broker and margin regime; our accounts run portfolio margin, and your own broker’s number is the one that matters. Nothing here is a recommendation on any individual holding named. Fill prices are taken from our September 18 broker export and are gross of commissions and fees.
Past performance is not indicative of future results, and results shown are those of our own accounts and are not representative of any subscriber’s results. Read the Characteristics and Risks of Standardized Options before trading.
Tony Rihan and Tony Battista Grow Your Pile · Squared T Capital
Every options trade in all three portfolios is published, win or lose, with entry, exit and running P&L at growyourpile.com.