


Can You Really Make $87.50 a Day Trading Options?
The Real Math Behind Returns, Margin, Buying Power & Risk
Grow Your Pile Office Hours | Tony Rihan & Tony Battista
Everyone wants to know the answer to one question:
“How much money can I realistically make trading options?”
It’s probably the question we hear more than any other at Grow Your Pile.
And our answer has always been the same:
It depends on how much risk you’re willing to take.
But that answer isn’t particularly helpful unless we put some real numbers behind it.
So during this week’s Office Hours, Tony Battista and I decided to break down the mathematics of generating trading income, using a hypothetical $100,000 trading account.
We discussed the actual dollar amounts required to pursue different returns, how margin accounts affect capital efficiency, how much premium you need to sell, and why managing buying power, delta, and position size is essential.
We also talked about the part that most trading advertisements conveniently ignore:
Losing trades, drawdowns, and what happens when the market doesn’t cooperate.
This wasn’t a presentation about getting rich quickly.
It was about understanding what it really takes to Grow Your Pile.
1. The $87.50-a-Day Question
Let’s begin with some simple arithmetic.
Assume you have a $100,000 trading account and approximately 20 trading days per month.
Here’s what different monthly return objectives translate into:
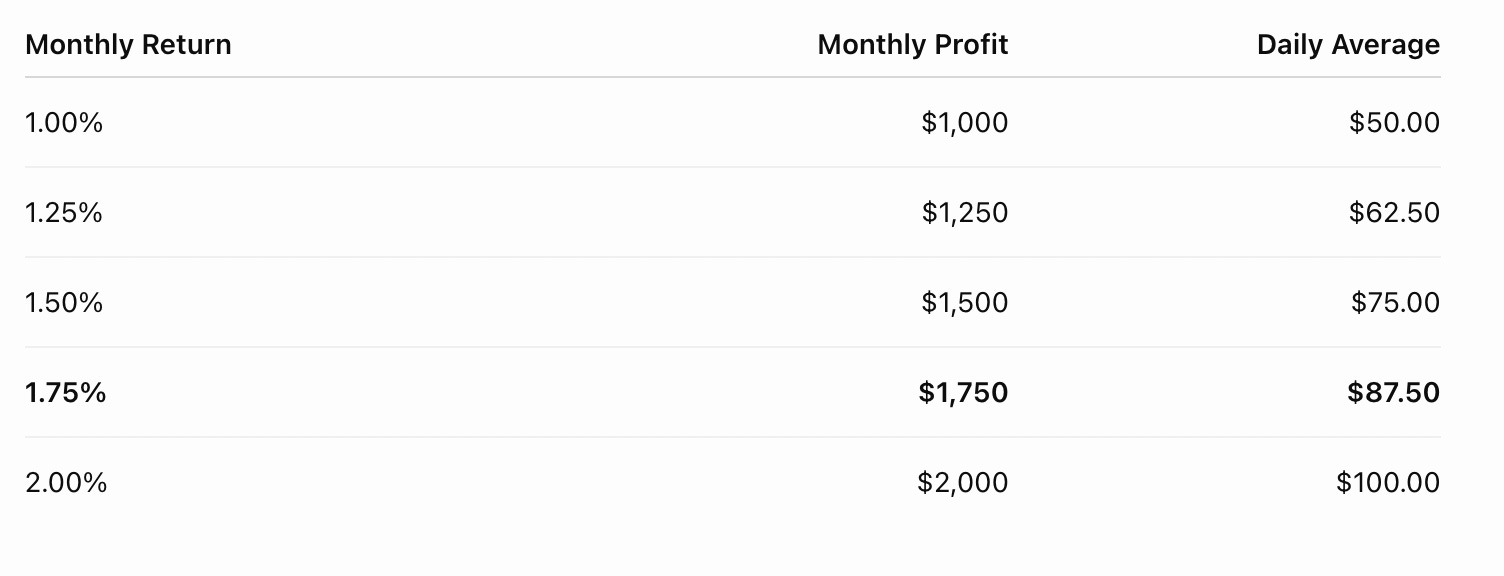
At Grow Your Pile, we’ve often discussed pursuing returns in the neighborhood of 1% to 1.75% per month, depending on market conditions, account structure, and risk exposure.
These are objectives, not guaranteed or predictable monthly results.
But let’s focus on 1.75%.
That’s just $87.50 per trading day on a $100,000 account.
Doesn’t sound too difficult, right?
Not so fast.
The challenge isn’t making $87.50 on a good trading day.
The challenge is generating sufficient profits over time to overcome losing trades, transaction costs, unfavorable markets, and inevitable drawdowns.
And doing it without taking so much risk that one bad month destroys a year’s worth of progress.
2. Small Monthly Percentages Become Big Annual Numbers
Here’s something many investors underestimate.
A monthly return of 1.5% translates into an 18% annual return without compounding.
If you reinvest those profits every month and achieve that same percentage return consistently, the annualized result increases to approximately 19.56%.
At 1.75% monthly:
Simple annual return: 21%
Compounded annual return: approximately 23.14%
That’s a substantial annual return.
And consistently achieving it is an ambitious goal.
We also discussed how withdrawing profits changes the equation.
In Portfolio 1, Tony Rihan shared how he withdrew approximately $100,000 in accumulated profits around July, rather than continually increasing the trading account’s capital base.
That decision makes it easier for him to monitor performance against a consistent portfolio size.
Of course, taking profits out also means those dollars are no longer compounding inside that particular account.
Trading for Wealth vs. Trading for a Living
We spent time discussing an important distinction.
Trading to grow your wealth is very different from trading to pay your monthly bills.
If you need $10,000 every month to support your family, the pressure to generate consistent profits becomes significantly greater.
You can’t tell your mortgage company that the market didn’t cooperate this month.
And you must also consider taxes.
For example, if you need $10,000 per month after taxes, you may need substantially more in gross trading profits, depending on your personal tax circumstances.
Even a $1 million account doesn’t automatically solve that problem.
Trading income is variable. Living expenses usually aren’t.
Our takeaway:
Don’t build your lifestyle around the assumption that you’ll make money every month.
3. Account Equity, Cash and Buying Power Are NOT the Same Thing
This was one of the most important educational sections of the entire session.
We explained three concepts every options trader should understand.
Net Liquidation Value (Net Liq)
This represents the estimated value of your trading account if all positions were liquidated at current marks.
It’s the number we believe traders should use when evaluating portfolio returns.
Buying Power Reduction (BPR)
This represents the capital capacity your brokerage requires to support your positions.
For example, you might have a $100,000 account and open a position that consumes $10,000 in buying power.
You haven’t necessarily lost $10,000.
But you’ve committed part of your trading capacity to that position.
Cash Balance
Your cash balance is different again.
Option premiums, stock purchases, assignments, and other transactions can change your cash balance without changing your account equity by the same amount.
Tony Rihan shared a personal experience where he reduced trading risk but still received a broker request for additional cash.
The lesson was that reducing economic exposure doesn’t automatically resolve every cash or margin requirement.
Understanding these differences is fundamental to managing a leveraged trading account.
4. Cash-Secured, Regular Margin and Portfolio Margin
Not every $100,000 account has the same ability to deploy capital.
We compared three different account structures.
Cash-Secured Accounts
These accounts may require enough cash to support the full obligation of a short put.
That can make premium-selling strategies considerably more capital-intensive.
Regular Margin Accounts
Regular margin generally provides greater capital efficiency than cash-secured trading, but uncovered options still require substantial buying power.
Portfolio Margin Accounts
Portfolio margin uses risk-based calculations and can recognize offsets between qualifying positions.
In our live examples, we discussed how a trade requiring roughly $3 of buying power under regular margin might require approximately $1 under portfolio margin.
That was an illustrative comparison—not a universal 3-to-1 rule.
Actual requirements depend on the positions, account, broker, and market conditions.
The critical lesson was:
Same trade. Same economic risk. Potentially very different buying-power requirement.
And there’s a catch.
Portfolio margin can make it easier to take on too much exposure.
Just because your broker requires less buying power doesn’t mean your trade has become safer.
In fact, that additional leverage can become dangerous when volatility expands and markets move sharply.
We also discussed why our GYP Portfolio 1 and Portfolio 2 account-size guidelines matter when members are considering automated trading.
The account sizes and margin structure affect how closely members can replicate the capital exposure of our portfolios.
5. How Much Buying Power Should You Actually Use?
We discussed the buying-power framework used at Grow Your Pile.
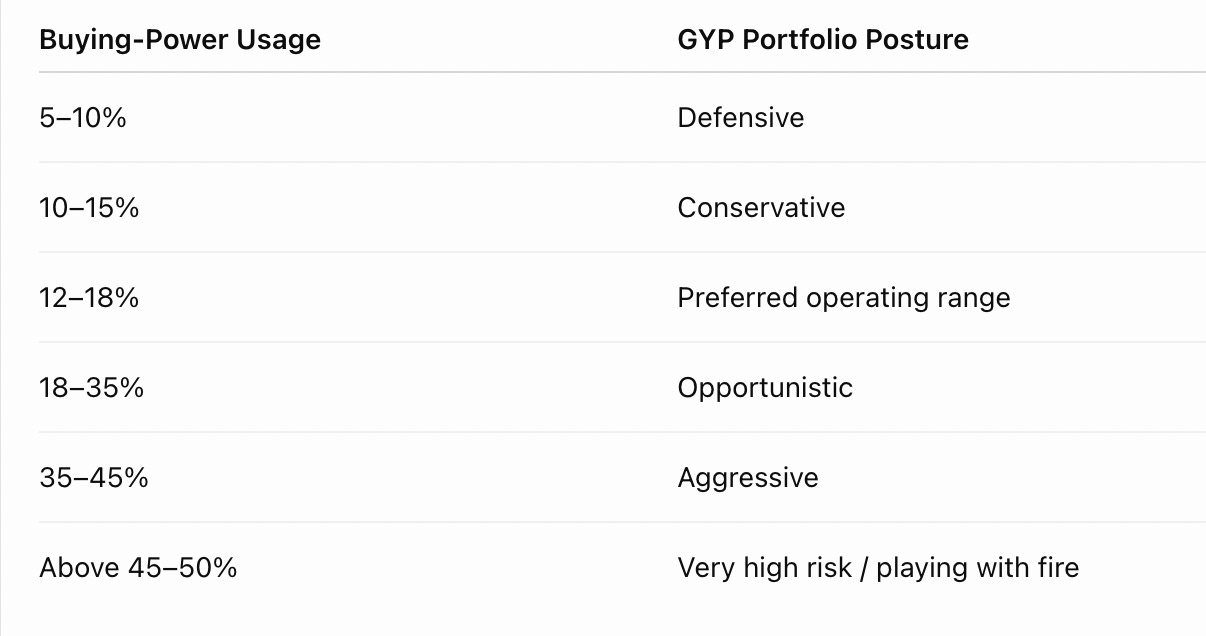
These are internal GYP guidelines, not universal safety thresholds.
We emphasized that account type matters enormously.
Using 30% buying power in a portfolio margin account can represent substantially more economic exposure than using 30% in a regular margin account.
But even buying-power percentage alone isn’t enough.
You must also monitor:
Units + Delta + Buying Power + Extrinsic Value
Tony Battista explained that he pays particular attention to contract count and total portfolio delta.
In the discussion, he described how the automated trading portfolio had approximately 250–300 deltas with five short-put contracts across SPY and QQQ.
He also explained why he prefers leaving room to adjust rather than deploying all his available contracts immediately.
The Double Whammy
When you sell puts and the market falls, two things can happen simultaneously:
First: Your short puts lose value, reducing your account equity.
Second: Your broker may increase the buying power required to maintain those same positions.
That means your account equity is shrinking while your margin requirement is growing.
This is one of the most dangerous dynamics in leveraged options trading.
And it’s exactly why we believe buying-power reserves are so important.
6. Collecting Premium Is NOT the Same as Making Money
This was probably my favorite part of the session.
When I first started trading options, I made a mistake that many beginners make.
I wanted to generate a certain amount of income, so I simply sold that amount in option premium.
Want to make $20,000?
Sell $20,000 in premium!
Unfortunately, that’s not how options trading works.
Premium received is not profit earned.
When you sell an option, you receive cash but also create an obligation.
The ultimate profit depends on what happens to that obligation and how much it costs to close or settle it.
We discussed the concept of premium capture.
If you sell $1,000 in option premium and ultimately retain $400 in net profits, you’ve captured 40%.
But that capture percentage varies significantly by strategy, duration, market environment, and trade management.
Tony Battista noted that traditional 45-day premium-selling approaches may capture a smaller portion over time, while our more actively managed shorter-duration trades have sometimes captured a larger share.
We also discussed historical capture rates around 25% for certain traditional approaches, versus the higher capture percentages we’ve experienced in parts of our own trading.
Those figures are strategy-specific observations, not guarantees.
The $1,750 Monthly Profit Calculation
Let’s assume you want to earn $1,750 per month.
How much gross premium would you need to sell?
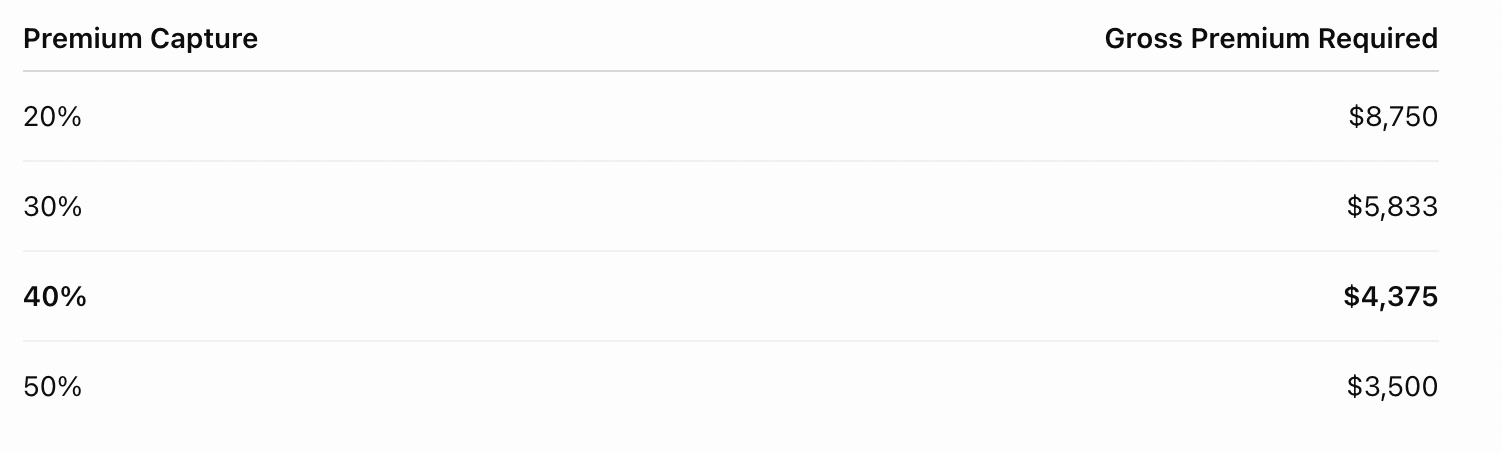
Now the picture changes.
To earn $1,750, you may need to sell considerably more than $1,750 in premium.
And the amount of premium you can reasonably sell depends on the buying power, number of contracts, and directional risk you’re willing to accept.
That brings us right back to position sizing.
7. What Happens When You Have a $1,000 Losing Day?
Suppose you’re targeting $1,750 per month.
Then you experience a difficult trading day and lose $1,000.
Now the rest of your trading activity has to overcome that loss before you can reach your original objective.
We discussed how that could require increasing the gross premium sold to perhaps $6,000 in an illustrative scenario.
But here’s the important distinction:
Selling more premium doesn’t eliminate the risk of additional losses.
It may actually increase your exposure.
A losing day is not an invitation to double your position size.
And we shouldn’t confuse increasing our trading activity with improving our expected return.
Sometimes the correct response is to reduce exposure, adjust deltas, or simply wait.
8. Why We Prefer Fewer Contracts and Better Positioning
Tony Battista explained a concept that we strongly agree on.
He often prefers collecting more premium per contract while using fewer total contracts.
Why?
Because fewer units leave additional flexibility if the market moves against you.
You can adjust.
You can roll.
You can potentially add exposure later, if justified by your risk limits.
But if you’re already at your maximum contract size, your choices become much more limited.
This is why position sizing is one of the most important decisions we make before entering a trade.
A trader with ten contracts and very little current delta may still have substantial tail risk if the market makes a sharp move.
Low delta today doesn’t guarantee low delta tomorrow.
9. Real Trading: Managing Positions When Things Go Wrong
We also discussed actual portfolio adjustments during the recent Nasdaq weakness.
Tony Battista reviewed his SPY and QQQ short puts and the different ways those positions had reacted to the market decline.
We explained why a short put that moves deeper in the money may need to be rolled down, rolled out, or otherwise adjusted.
In one example, Tony described moving QQQ short-put strikes lower for approximately a scratch or small net credit.
We also discussed a member question about deep-in-the-money short puts and whether it makes sense to continue rolling at the same strike.
Tony explained that he generally prefers moving strikes closer to the money rather than becoming anchored to the original entry.
The market doesn’t care about your cost basis.
That’s an important lesson.
We also compared different approaches to managing a challenged GLD position, highlighting how personal conviction, position size, and trading objectives can lead to different decisions.
10. The Danger of Chasing 3%, 4% or 5% Every Month
Toward the end of the session, we returned to the central question.
What is a reasonable return objective for an options premium-selling portfolio?
We discussed a range of approximately 1% to 1.75% monthly as an objective under favorable conditions and with disciplined risk management.
But we also warned about traders advertising 3%, 4%, or even 5% monthly returns through high-probability premium selling.
Those returns may occur during individual months or favorable market periods.
The real question is what happens when volatility spikes, correlations change, and the market experiences a major drawdown.
High-probability trades can still have very large losses.
And a strategy that looks brilliant for six months can suffer dramatically when market conditions change.
We want members to understand the risk they’re taking—not just the income they hope to generate.
11. Questions From Our Members
We finished with several excellent questions, including:
Should Treasury-like ETF holdings count the same as options exposure when evaluating buying power?
We discussed why it’s useful to distinguish income-oriented collateral holdings from leveraged options exposure, while recognizing that both still have actual broker margin requirements and investment risks.
Can you increase buying-power usage by trading uncorrelated assets?
We cautioned that correlations can change dramatically during market stress.
Assets that appear diversified in normal markets can suddenly move together.
Should you wait for a better price before making defensive adjustments?
Tony Battista explained that some trading decisions allow discretion, but he treats position sizing and delta limits as rules that should not be casually broken.
What if you don’t have access to portfolio margin?
We discussed alternatives such as defined-risk spreads and other structures, while recognizing that they change the economics and risk profile of the trade.
Our Final Takeaway: Four Numbers Every Trader Should Watch
At Grow Your Pile, we believe successful portfolio management requires understanding more than how much premium you collect.
There are four measurements we continually emphasize:
1. UNITS — How many contracts do you have?
2. DELTA — How much directional exposure are you carrying?
3. BUYING POWER — How much capital capacity are you consuming?
4. EXTRINSIC VALUE — How much premium are you actually selling and potentially capturing?
You need to understand all four.
Because the goal isn’t simply to make $87.50 today.
It’s to build a repeatable trading process that can survive difficult markets and allow your capital to grow over time.
The best trading strategy isn’t necessarily the one that makes the most money during a good month.
It’s the one whose risks you understand and can manage when things go wrong.
That’s what we’re trying to teach at Grow Your Pile.
And remember...
YOU GOTTA RISK IT TO GET THE BISCUIT!
Tony Rihan & Tony Battista
Grow Your Pile
🔒 PAID GYP MEMBERS — WATCH THE FULL OFFICE HOURS REPLAY
🎥 Full Video: How Much Can You Realistically Make Trading Options?
Watch Tony Rihan and Tony Battista walk through the live trading-platform examples, actual margin comparisons, premium-capture calculations, portfolio-management decisions, and member questions.
Not a paid GYP member yet?
Upgrade your membership to access our complete Office Hours video library, portfolio-management education, trading discussions, and exclusive member resources.
